
Selecting Trading Systems
How to identify and select robust trading systems from GSB Pro's results
Overview
After GSB Pro completes a run, it will have developed numerous trading systems. Your task is to find systems with good balanced performance over both the training (in-sample) and testing (out-of-sample) data periods. This page explains how to evaluate and select the best systems.
Understanding the Results Table
GSB Manager typically takes about 2 additional minutes to start its workers. Once finished, you'll see a table displaying all developed trading systems with their performance metrics.
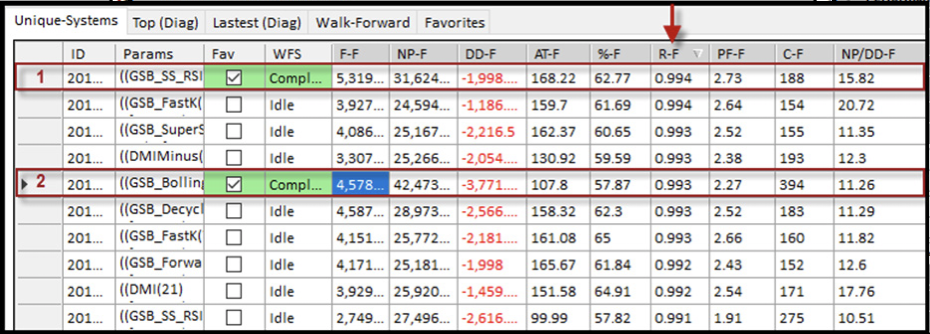
Results table with trading systems sorted by performance
Key Performance Metrics
Click on column headings to sort systems by different parameters:
Measures how close the equity curve is to a straight line over the full period. Values closer to 1.0 indicate more consistent, linear growth. Look for values above 0.95.
Ratio of total profit to maximum drawdown. Higher values indicate better risk-adjusted returns. Aim for at least 15:1 or higher.
- NP-F (Net Profit - Full Period): Total profit generated
- %-F (Win% - Full Period): Percentage of winning trades
- C-F (Count - Full Period): Total number of trades
- AT-F (Average Trade - Full Period): Average profit per trade
- PF-F (Profit Factor - Full Period): Gross profit ÷ gross loss
Selection Criteria
When evaluating trading systems, look for the following characteristics:
1. Trade Count
A reasonable number of trades provides statistical significance. Aim for:
- Minimum 200 trades over the full period
- More trades generally indicate more robust patterns
- Too few trades may indicate overfitting to specific market conditions
2. Average Trade Size
Larger average trades suggest the system captures meaningful price movements:
- Preferably over $100 per trade after costs
- Should significantly exceed commission and slippage
- Consistent with the market being traded
3. Win Percentage
Balance between win rate and profit size is important:
- Around 60% or higher is desirable
- Can be lower if average wins significantly exceed average losses
- Extremely high win% (>80%) may indicate curve-fitting
4. Profit Factor
Ratio of gross profits to gross losses:
- Close to 2.00 or higher is preferred
- Minimum acceptable is usually 1.5
- Higher profit factors indicate more efficient trading
5. Drawdown
Maximum peak-to-trough decline in equity:
- Smaller drawdowns indicate smoother equity curves
- Compare drawdown to total net profit (NP/DD ratio)
- Consider your risk tolerance
Analyzing the Equity Curve
The equity curve is the most important visual tool for assessing system robustness. To view it, select a system from the results table.
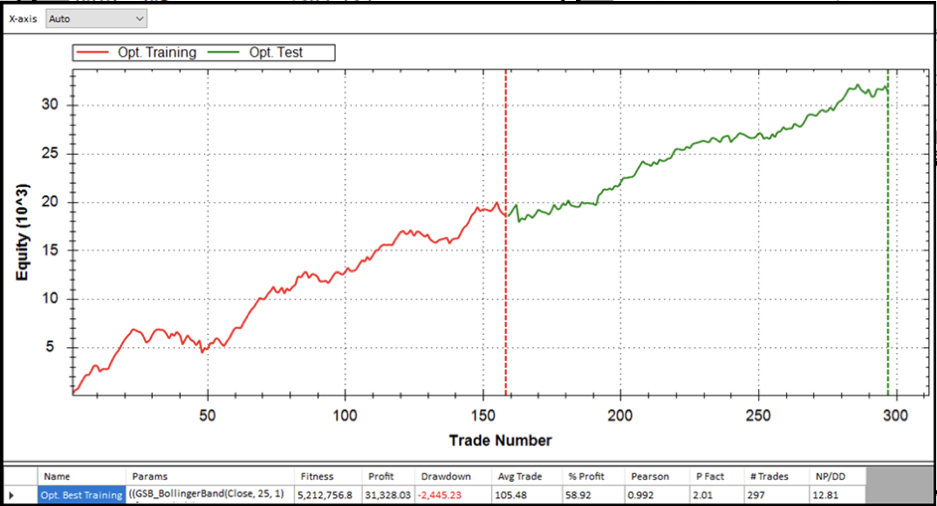
Equity curve with training period (red) and testing period (green) showing consistent performance
- Linear growth: The curve should climb steadily without major dips
- Consistent performance: Similar slope in both training (red) and testing (green) periods
- Small drawdowns: Temporary dips should be shallow and recover quickly
- No flat periods: Extended flat regions suggest the system stopped working
- Smooth transitions: The curve shouldn't change dramatically between in-sample and out-of-sample periods
Training vs. Testing Performance
Scroll the results table to the right to see performance broken down by training and testing periods:
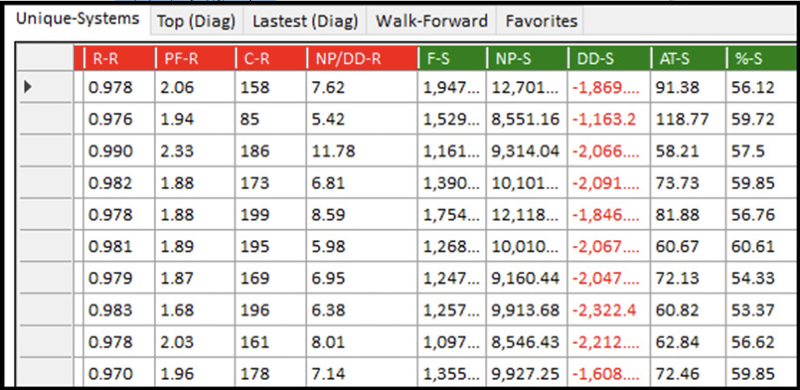
Performance metrics for in-sample (IS) and out-of-sample (OOS) periods
- R-R (Ratio - Training): Reliability ratio for training period
- PF-R (Profit Factor - Training): Gross profit ÷ gross loss in training
- F-S (Fitness - Testing): Fitness score for testing period
- NP-S (Net Profit - Testing): Total profit in out-of-sample period
Be cautious if you see:
- Excellent training performance but poor testing performance
- Dramatic difference in profit factor between periods
- Win% drops significantly in testing period
- Equity curve changes slope dramatically between periods
- Very few trades in the testing period
Example Selection Process
Here's a practical approach to selecting systems:
- Sort by Pearson Coefficient (P-F): Click the P-F heading to sort from highest to lowest
- Review top candidates: Look at systems with P-F above 0.95
- Check NP/DD ratio: Ensure profit-to-drawdown ratio is acceptable
- Verify trade count: Confirm at least 200 trades
- Examine equity curve: Visual inspection for linear growth
- Compare metrics: Balance between profit, win%, trade size, and profit factor
- Shortlist 2-3 systems: Select top performers for walk-forward testing
Making the Final Selection
After narrowing down to a few candidates:
- Compare their equity curves side-by-side
- Consider your trading style and risk tolerance
- Choose the system with the most consistent performance across both periods
- Proceed to walk-forward optimization for final validation
Next Steps
Once you've selected promising systems:
- Run walk-forward optimization to further validate robustness
- Compare walk-forward results with original optimization
- Export the best-performing system to your trading platform