
Walk-forward optimization simulates real-world trading where you periodically reoptimize your system. It divides historical data into multiple periods, optimizing on one period and testing on the next, then rolling forward to repeat the process across your entire dataset.
Why Walk-Forward Optimization?
Traditional backtesting and even out-of-sample testing can be misleading because:
- Markets change over time - what worked in the past may not work now
- Single in-sample/out-of-sample split may be lucky or unlucky
- Real trading requires periodic reoptimization as market conditions evolve
- Walk-forward simulates this real-world process on historical data
How Walk-Forward Works
The Process
- Divide your data into multiple segments (anchored or rolling)
- Optimize on the first segment to discover/refine the system
- Test on the next segment using parameters from optimization
- Record the out-of-sample results
- Roll forward to the next period and repeat
- Combine all out-of-sample results for final performance metrics
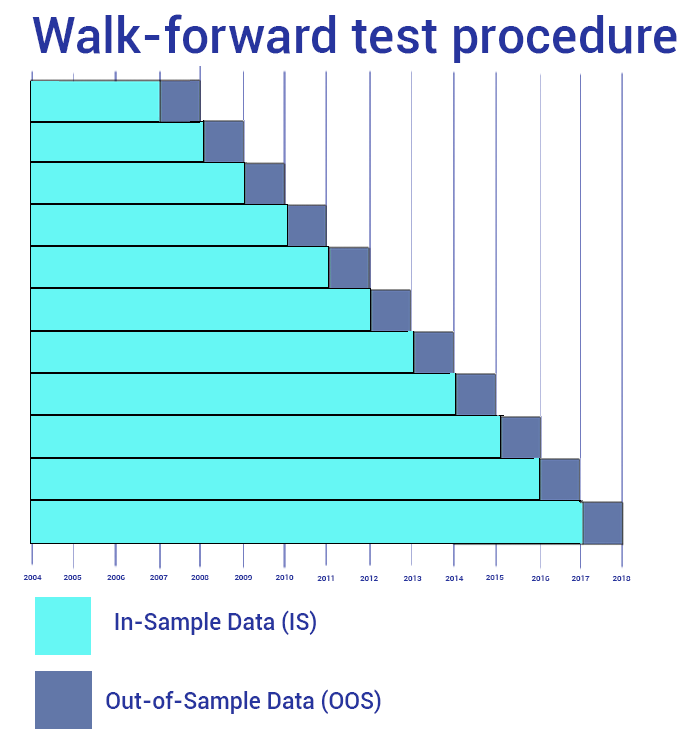
Walk-forward procedure: optimize on in-sample data (cyan), test on out-of-sample data (blue)
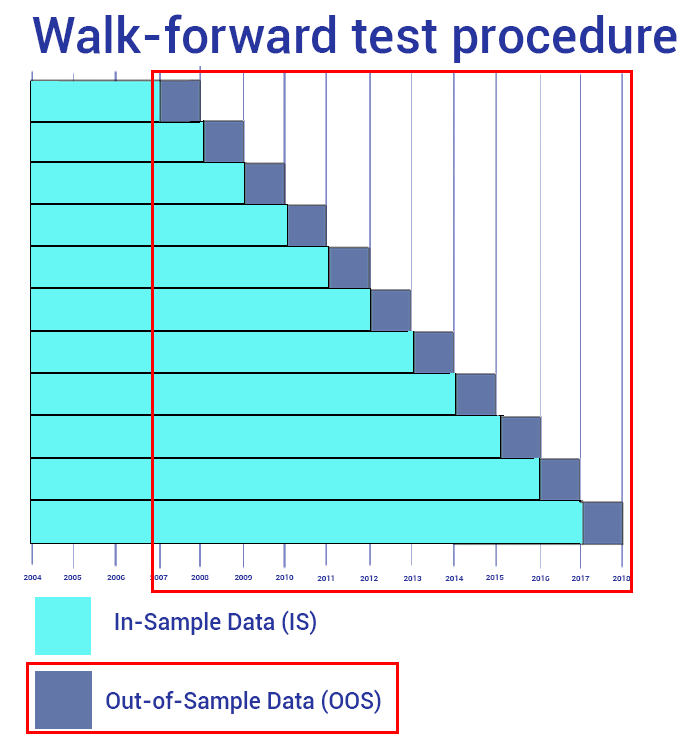
Anchored walk-forward: in-sample period (cyan) grows while out-of-sample period (blue) remains fixed
Anchored vs Rolling Walk-Forward
Method: In-sample period grows with each iteration
Example:
- Optimize: Year 1, Test: Year 2
- Optimize: Years 1-2, Test: Year 3
- Optimize: Years 1-3, Test: Year 4
Benefit: Uses more data for optimization as time progresses
Method: Fixed-size in-sample window rolls forward
Example:
- Optimize: Year 1, Test: Year 2
- Optimize: Year 2, Test: Year 3
- Optimize: Year 3, Test: Year 4
Benefit: Adapts more quickly to changing markets
Configuring Walk-Forward in GSB Pro
Key Settings
In-Sample Period Length
How much data to use for each optimization:
- Daily data: 1-2 years typical
- Intraday data: 6-12 months typical
- Rule of thumb: Enough for 100+ trades per optimization
Out-of-Sample Period Length
How long to test before reoptimizing:
- Common ratio: 70% in-sample, 30% out-of-sample
- Example: 12 months optimize, 6 months test
- Conservative: Shorter out-of-sample periods (3-4 months)
Number of Iterations
How many walk-forward cycles to run:
- Minimum: 3-4 iterations for meaningful results
- Recommended: 6-10 iterations
- More iterations = more robust validation
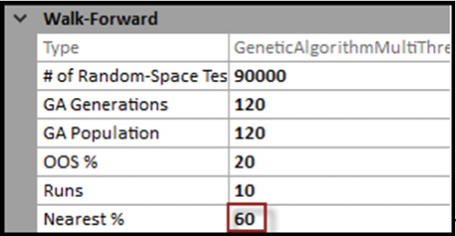
Walk-forward settings: configure optimization type, out-of-sample percentage, and number of runs
Running Walk-Forward in GSB Pro
After configuring your walk-forward settings and running an initial optimization, you can execute walk-forward analysis:
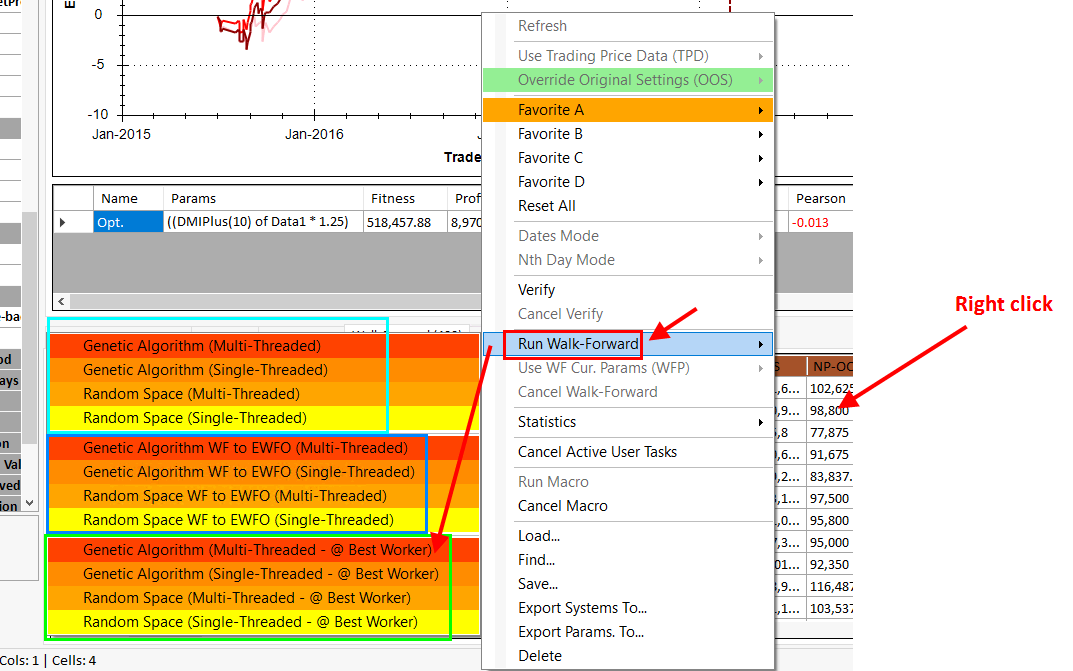
Right-click menu: select "Run Walk-Forward" to begin walk-forward optimization
Interpreting Walk-Forward Results
Performance Metrics
GSB Pro provides comprehensive walk-forward statistics:
- Combined out-of-sample equity curve: Shows how system would have performed with periodic reoptimization
- Per-iteration results: Performance in each out-of-sample period
- Average vs worst iteration: Shows consistency across different market conditions
- Parameter stability: How much parameters change between optimizations
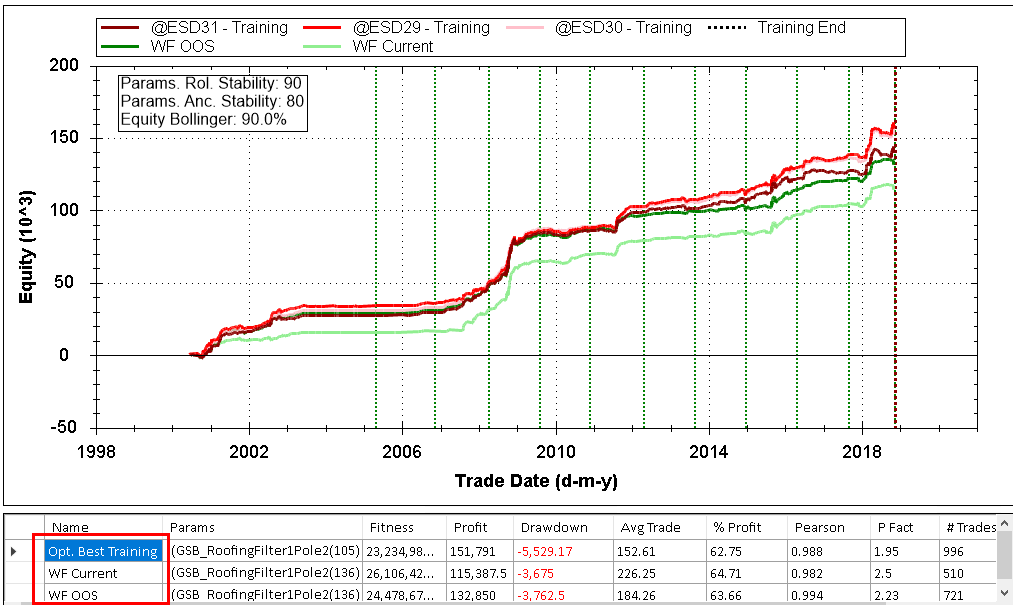
Combined walk-forward results: multiple systems tested across training and out-of-sample periods
Example Walk-Forward Equity Curves
Here are examples of walk-forward results showing different performance characteristics:
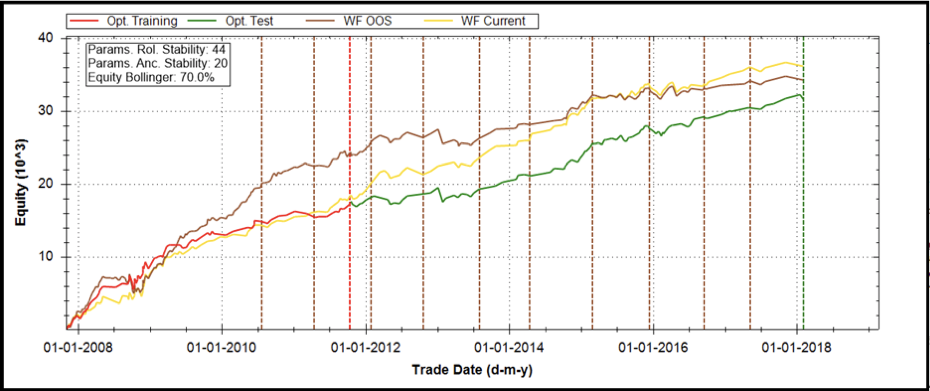
Walk-forward equity curve showing consistent performance across multiple reoptimization periods
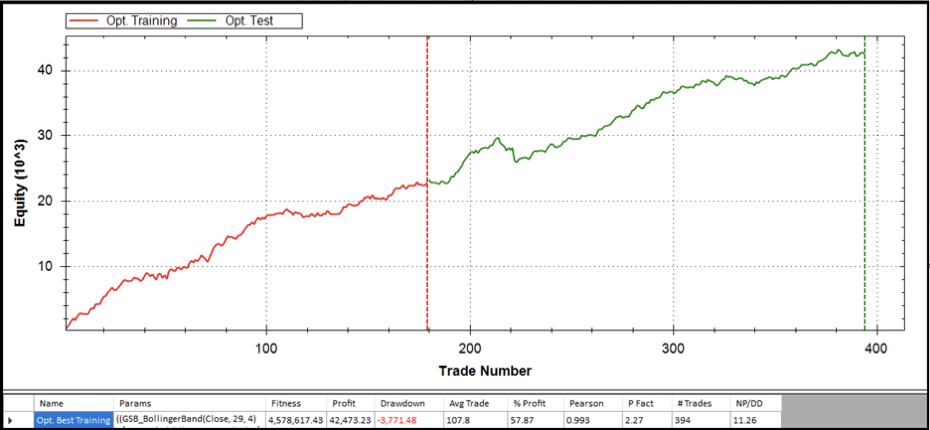
Equity curve by trade number: training (red) vs testing (green) performance
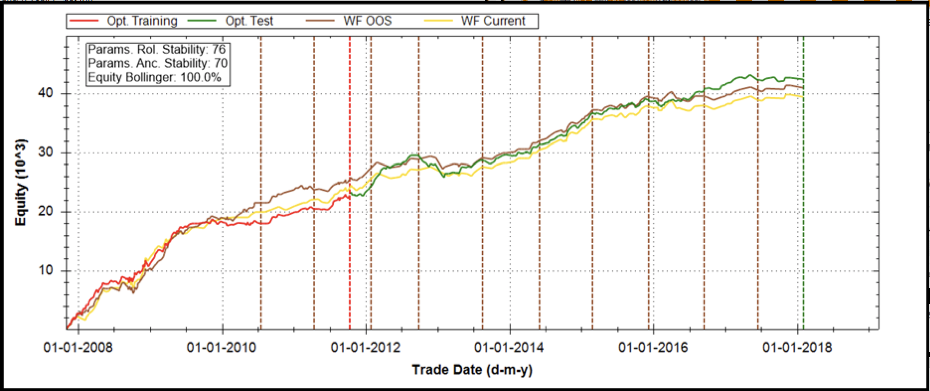
Walk-forward with high parameter stability (76/70) and consistent equity growth
What to Look For
- Majority of walk-forward iterations are profitable (60%+ recommended)
- Combined out-of-sample equity curve is smooth and rising
- Performance degradation from in-sample to out-of-sample is acceptable (<30%)
- Parameters don't change drastically between iterations
- No catastrophic losing periods that wipe out all gains
- Similar performance across different market conditions
Common Walk-Forward Mistakes
Too Few Iterations
Running only 2-3 walk-forward iterations doesn't provide sufficient validation. You might get lucky or unlucky. Aim for at least 6 iterations.
Too Short Out-of-Sample Periods
Very short out-of-sample periods (1-2 months) don't allow enough trades to be meaningful. The system needs time to demonstrate its edge.
Ignoring Parameter Drift
If optimal parameters change dramatically between iterations, the system may not have a stable edge. Look for systems where parameters remain relatively consistent.
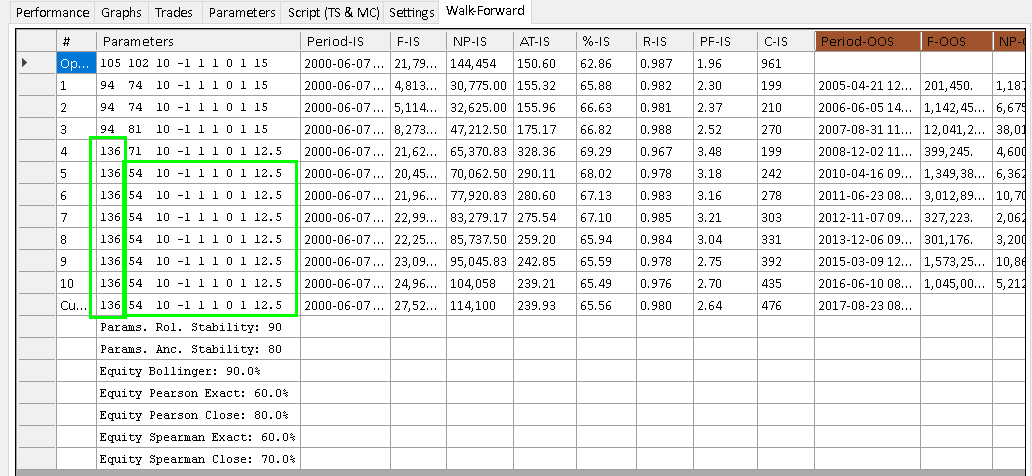
Parameter stability analysis: examine how parameters change across walk-forward iterations (Parameters Rol. Stability: 90, Anc. Stability: 80)
Accepting All Positive Results
A walk-forward result can be "positive" overall but still unreliable if most profit comes from one exceptional period. Examine individual iterations carefully.
Advanced Walk-Forward Techniques
Multi-Symbol Walk-Forward
Run walk-forward across multiple symbols simultaneously:
- Use same time periods for all symbols
- Optimize parameters for portfolio as a whole
- Test on out-of-sample across all symbols
- Provides even stronger validation
Walk-Forward with Reranking
Instead of using the best in-sample system:
- Optimize and generate top 10 systems
- Test all 10 on the out-of-sample period
- Select the best performer out-of-sample
- Use that system until next reoptimization
Real-World Application
Periodic Reoptimization Schedule
Walk-forward results inform how often to reoptimize in live trading:
- If walk-forward uses 6-month out-of-sample: Consider reoptimizing every 6 months
- If performance degrades quickly: More frequent reoptimization needed
- If stable across iterations: Less frequent reoptimization acceptable
Combining with Other Validation
Walk-forward is most powerful when combined with other validation methods:
- Basic out-of-sample testing
- Multi-symbol validation
- Parameter sensitivity analysis
- Walk-forward optimization
- Live paper trading before real money
Walk-Forward Panel: Configure out-of-sample testing methodology with in-sample/out-of-sample ratios, anchoring options, and number of forward periods
Period Configuration: Define training and testing window sizes using rolling, expanding, or anchored walk-forward methods
Walk-Forward Results: Analyze combined in-sample and out-of-sample performance with equity curves, drawdowns, and statistical metrics across all periods
Performance Report: View comprehensive walk-forward statistics to assess system robustness under realistic reoptimization scenarios
Next Steps
After validating your systems with walk-forward optimization, you're ready to export them to your trading platform.