
Portfolio Analyst Pro Documentation
Complete guide to portfolio construction, Monte Carlo analysis, and system optimization with Portfolio Analyst Pro.
Introduction
What is Portfolio Analyst Pro?
Portfolio Analyst Pro (PAp) combines TradeStation and MultiCharts performance reports to automatically discover the optimal combination of trading systems that maximizes your net profit to drawdown ratio. It's a standalone portfolio construction tool designed to work with GSB Pro systems or any trading strategies from supported platforms.
Portfolio Analyst Pro is a separate tool from GSB Pro. While GSB Pro helps you build individual trading systems, PAp helps you combine multiple systems into an optimized portfolio with the best risk-adjusted returns.
Key Capabilities
- Automatic Portfolio Optimization – Finds the best combination of systems to maximize net profit to drawdown ratio
- Monte Carlo Analysis – Stress-test your portfolios with thousands of simulated trading scenarios
- Money Management Overlays – Apply position sizing and risk constraints to your portfolio
- Correlation Analysis – Understand how systems interact and complement each other
- Multi-Platform Support – Works with TradeStation and MultiCharts performance reports
The Portfolio Construction Workflow
Using Portfolio Analyst Pro involves these steps:
- Export performance reports from TradeStation or MultiCharts
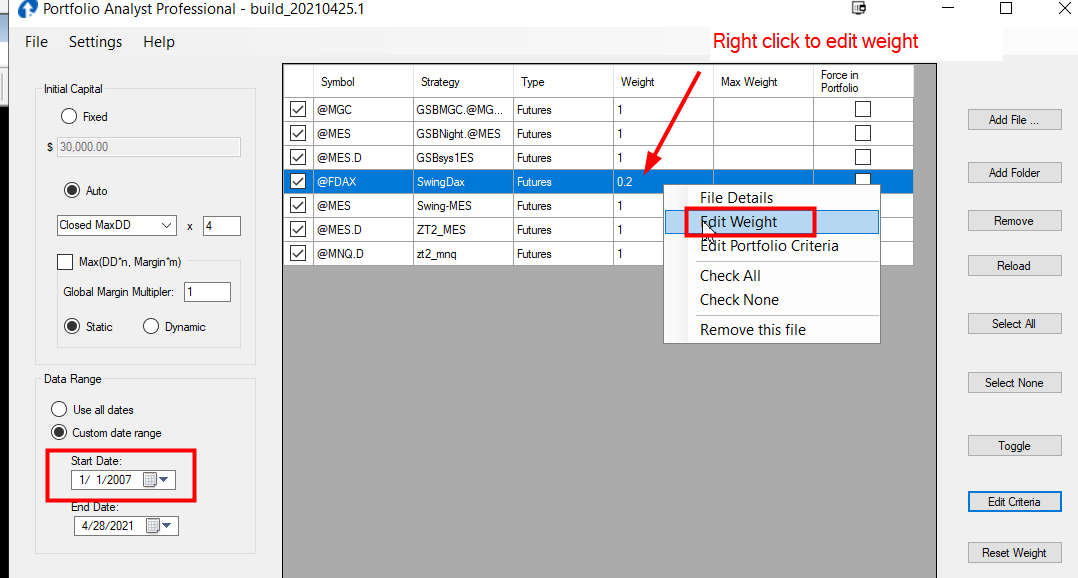
- Import reports into PAp and configure capital and date ranges
- Set money management and risk parameters
- Generate portfolio combinations and run Monte Carlo analysis
- Select optimal portfolio based on criteria limits and system constraints
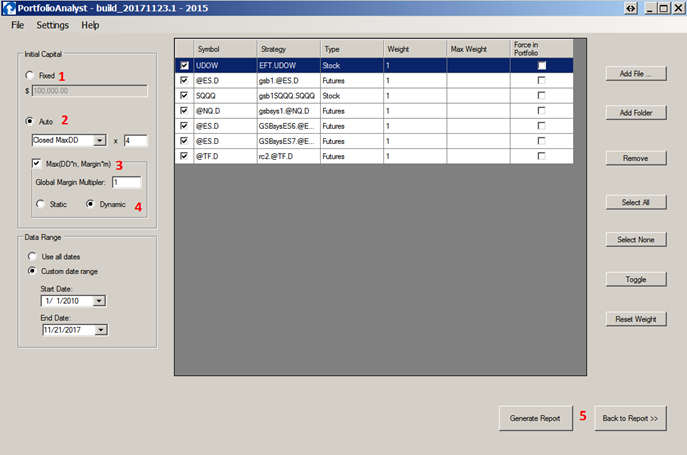
Portfolio Analyst Pro main interface showing system file management and portfolio configuration options
Data Flow & Setup
Getting Data from TradeStation
Portfolio Analyst Pro imports performance reports directly from TradeStation. The process involves exporting your strategy performance data in a format PAp can read:
- In TradeStation, open the Strategy Performance Report for your trading system
- Export the report using the TradeStation export function
- Save the file in a location accessible to Portfolio Analyst Pro
- Repeat for each trading system you want to include in your portfolio analysis
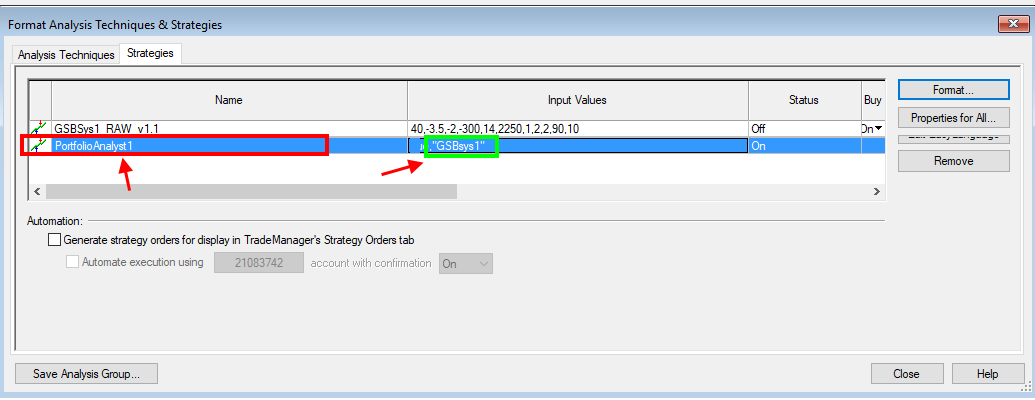
TradeStation data export process for importing into Portfolio Analyst Pro
MultiCharts Support
The November 2025 build added full support for MultiCharts MSA file format. To use MultiCharts data:
- Export your strategy as an MSA file from MultiCharts
- Ensure the file extension is
.msa - Use the provided PLA file for signal export:
C:\papro\TradestationCode\PortfolioAnalystMC1.25v2_SignalForMultiCharts_2025_03_24.pla
Initial Capital Configuration
Setting your initial capital correctly is essential for accurate portfolio analysis. PAp can automatically calculate required capital based on system drawdowns, or you can specify a fixed amount:
- Auto-Calculate – Derives capital from maximum system drawdowns
- Fixed Amount – Specify your actual trading capital
- Per-System Allocation – Set capital limits for individual systems
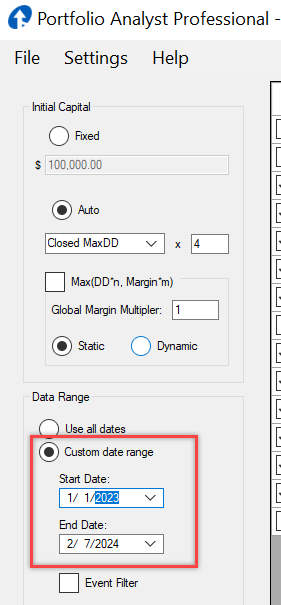
Data Range Settings
Configure the date range for your analysis to focus on specific time periods. This is useful for:
- Evaluating recent out-of-sample performance
- Comparing performance across different market conditions
- Filtering out early development period results
Working with Files
Inputting Files and Folders
Portfolio Analyst Pro provides flexible options for importing your trading system data:
- Individual Files – Add specific performance report files one at a time
- Folder Import – Import all compatible files from a directory
- Drag and Drop – Simply drag files into the PAp interface
File Input Details
Each imported file shows important details in the file list:
- Market symbol and strategy name
- File path location
- Per-contract commission settings
- Slippage assumptions
- Margin requirements
File Details Editing
You can modify file settings to customize your analysis:
- Adjust commission and slippage values for more realistic modeling
- Set margin requirements specific to your broker
- Rename systems for clearer identification
- Assign categories for criteria-based portfolio limits
File details editing panel showing commission, slippage, and margin configuration
Reports & Navigation
Generate Report
Once your files are configured, click "Generate Report" to create a comprehensive portfolio analysis. The report includes:
- Performance summary with key metrics
- Equity curves and drawdown analysis
- Correlation matrices
- Individual system breakdowns
- Trade-by-trade history
Report Details
The generated report provides detailed performance metrics:
- Net Profit – Total profit after commissions and slippage
- Maximum Drawdown – Largest peak-to-trough decline
- Profit Factor – Gross profit divided by gross loss
- Sharpe/Sortino Ratios – Risk-adjusted return metrics
- Win Rate – Percentage of profitable trades
Report Navigation
The left-hand menu provides easy navigation through different report sections:
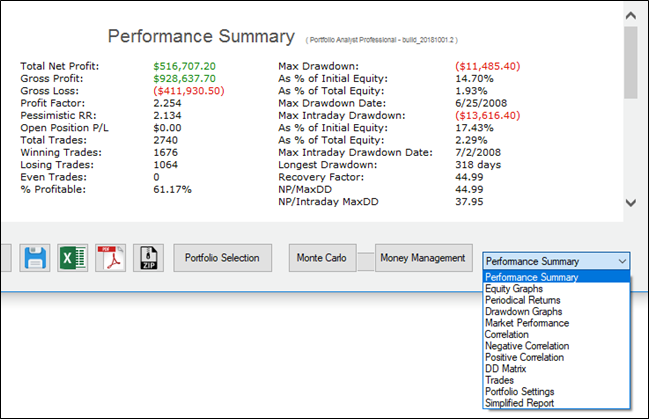
Report navigation showing key sections including performance summary, equity curves, drawdowns, and correlation analysis
- Performance Summary – Overview of all key metrics
- Periodical Returns – Annual, monthly, weekly, and daily breakdowns
- Equity Graphs – Visual equity curve analysis
- Drawdown Graphs – Drawdown depth and duration analysis
- Market Performance – Per-market and per-system results
- Correlation Analysis – System interaction matrices
- Trade List – Detailed trade-by-trade history
Money Management
Money Management Overlays
Portfolio Analyst Pro allows you to apply money management rules to your portfolio analysis. This helps you understand how different position sizing and risk strategies affect performance.

Money management configuration showing position sizing matrices and risk parameters
Position Sizing Options
- Fixed Contracts – Trade a constant number of contracts per system
- Percent Risk – Size positions based on account risk percentage
- Kelly Criterion – Optimal bet sizing based on win rate and payoff ratio
- Maximum Margin – Limit positions based on margin requirements
Portfolio vs. Individual Instruments
You can view money management analysis for the entire portfolio or drill down into individual instruments. To see money management for a specific instrument:
- Select the instrument from the dropdown list
- Click the "Recalculate" button
- Review the updated money management metrics
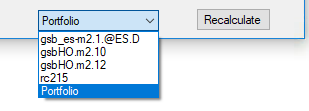
Individual instrument money management view with recalculate option
Monte Carlo Analysis
What is Monte Carlo Analysis?
Monte Carlo analysis generates thousands of simulated trading scenarios by randomly reordering trades. This helps you understand the range of possible outcomes for your portfolio and assess robustness beyond a single historical sequence.

Monte Carlo simulation showing equity curve distributions and confidence intervals
Why Use Monte Carlo?
- Understand Worst-Case Scenarios – See potential maximum drawdowns across thousands of simulations
- Confidence Intervals – Determine the probability range for future returns
- Stress Testing – Validate portfolio robustness under different trade sequences
- Risk Assessment – Make informed decisions about capital allocation
Monte Carlo Results
The Monte Carlo analysis provides several key outputs:
- Equity curve distribution with confidence bands
- Drawdown distribution and probabilities
- Statistical summary of returns across simulations
- Risk metrics at various confidence levels
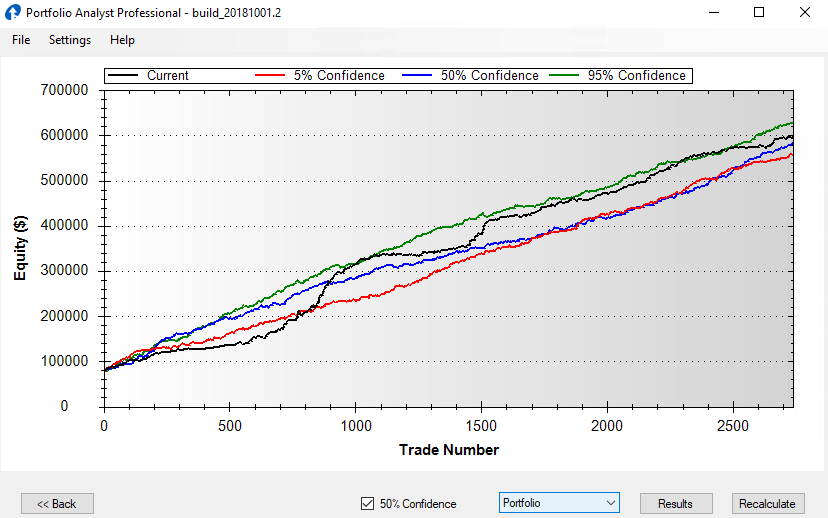
Monte Carlo results showing statistical distribution of portfolio outcomes
Analyzing Individual Instruments
You can run Monte Carlo analysis for the entire portfolio or individual instruments. Select the instrument from the dropdown and click "Recalculate" to see instrument-specific Monte Carlo results.
Portfolio Construction
Portfolio Selection
Portfolio Analyst Pro automatically finds the optimal combination of systems that maximizes your net profit to drawdown ratio. The portfolio selection process considers:
- System correlations to reduce overall portfolio risk
- Individual system performance metrics
- Diversification across markets and strategies
- Your specified constraints and limits
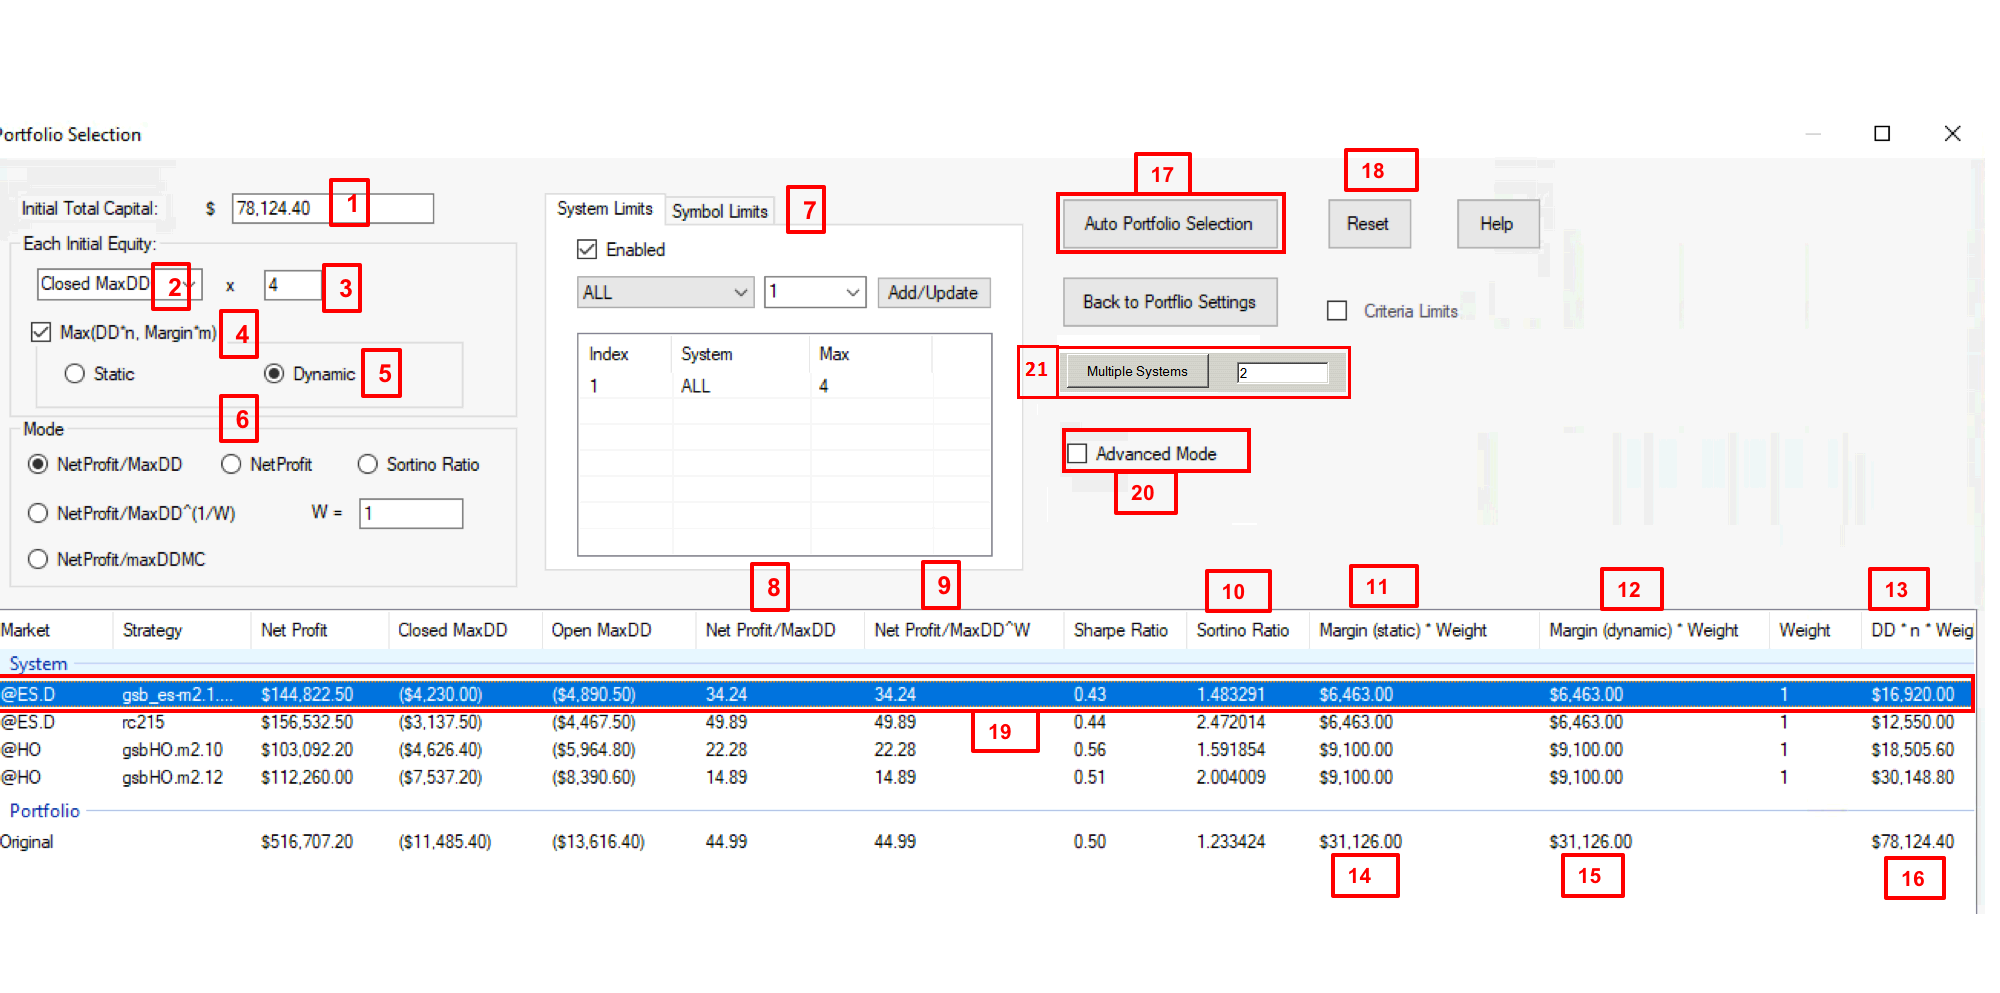
Portfolio selection results showing optimal system combinations
Portfolio Generation
When generating portfolios, you can configure various parameters:
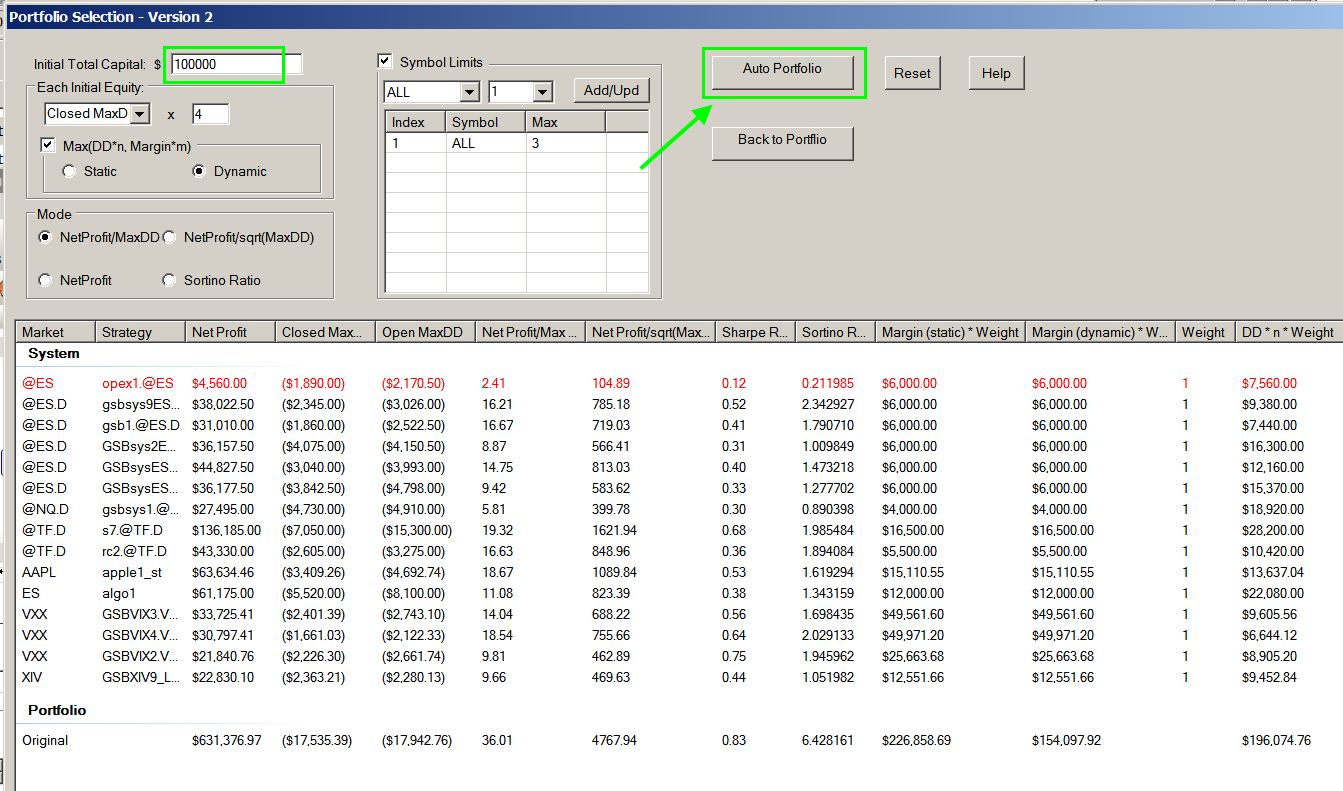
Portfolio generation configuration with account size and contract limits
Symbol Limits
Control exposure to individual markets by setting maximum contracts per symbol. For example, to limit each market to one contract:
- Enter your account size (e.g., 100,000)
- Change "Symbol Limits All" to 1
- The portfolio will now include no more than one contract per market
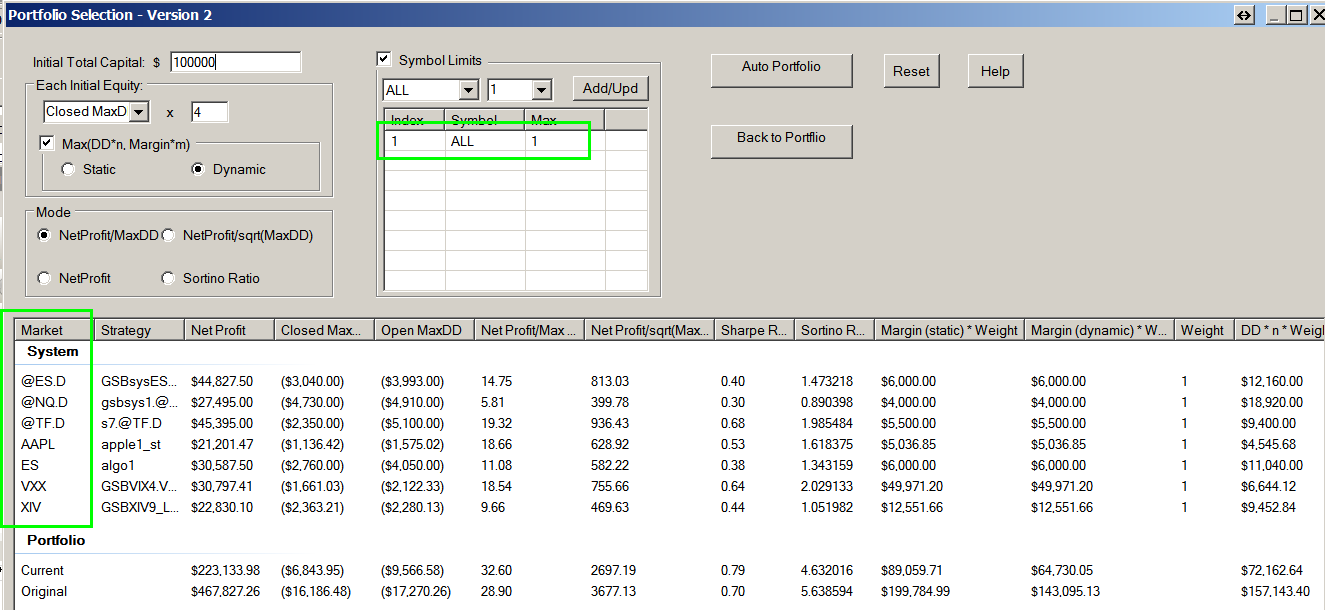
Portfolio with symbol limits applied, restricting to one contract per market
Saving Account Configurations
You can save different account configurations for various brokers or client accounts, allowing quick switching between portfolio setups.
Advanced Features
Advanced Mode
When you switch to "Advanced Mode," you get access to four optimization methods for finding portfolio solutions:
- Smart – (Default) Provides the most balanced CPU use to find portfolio solutions
- Genetic Algorithm – Evolutionary optimization for large solution spaces
- Brute Force – More thorough but slower; impractical for larger portfolios
- Particle Swarm Optimization – Alternative optimization technique
Criteria Limits
The criteria limits feature allows you to set constraints on your portfolio composition. For example, you might limit your portfolio to:
- 2 energy systems
- 3 stock index systems
- 1 trend following system
- 2 counter-trend systems
- 1 mean reversion system
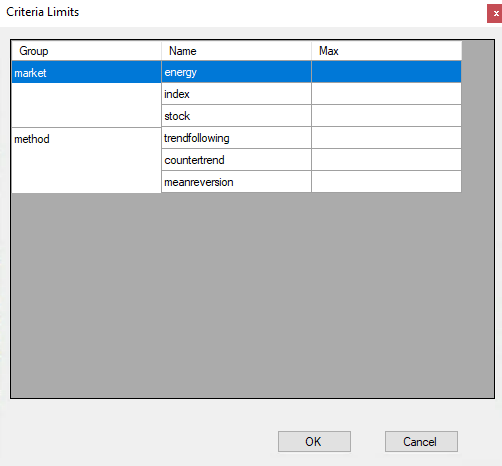
Criteria limits configuration for controlling portfolio composition by category
System Limits
System limits provide additional control over individual system inclusion in your portfolio:
- Set minimum and maximum contracts per system
- Exclude specific systems from portfolio generation
- Force inclusion of certain systems
- Balance exposure across different market sectors
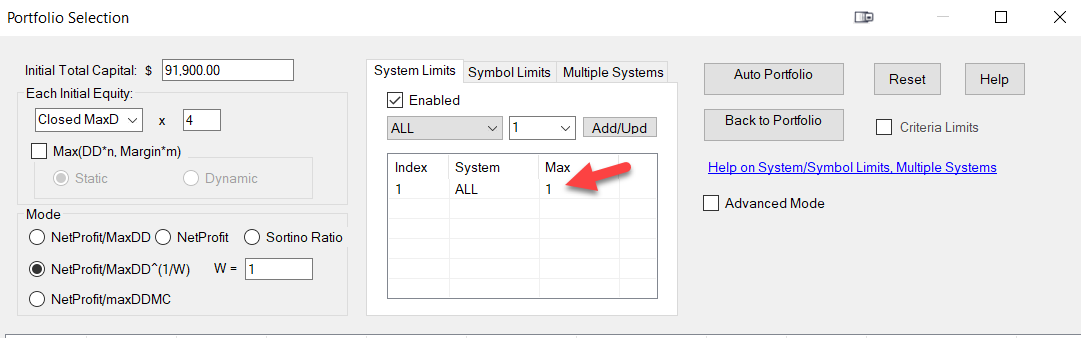
System limits configuration for controlling individual system inclusion
News/Events Date Filters
Filter your analysis around specific news events or market periods. This is useful for:
- Excluding performance during major market disruptions
- Analyzing system behavior around Fed announcements
- Evaluating performance before/after significant events
- Stress-testing with known volatile periods
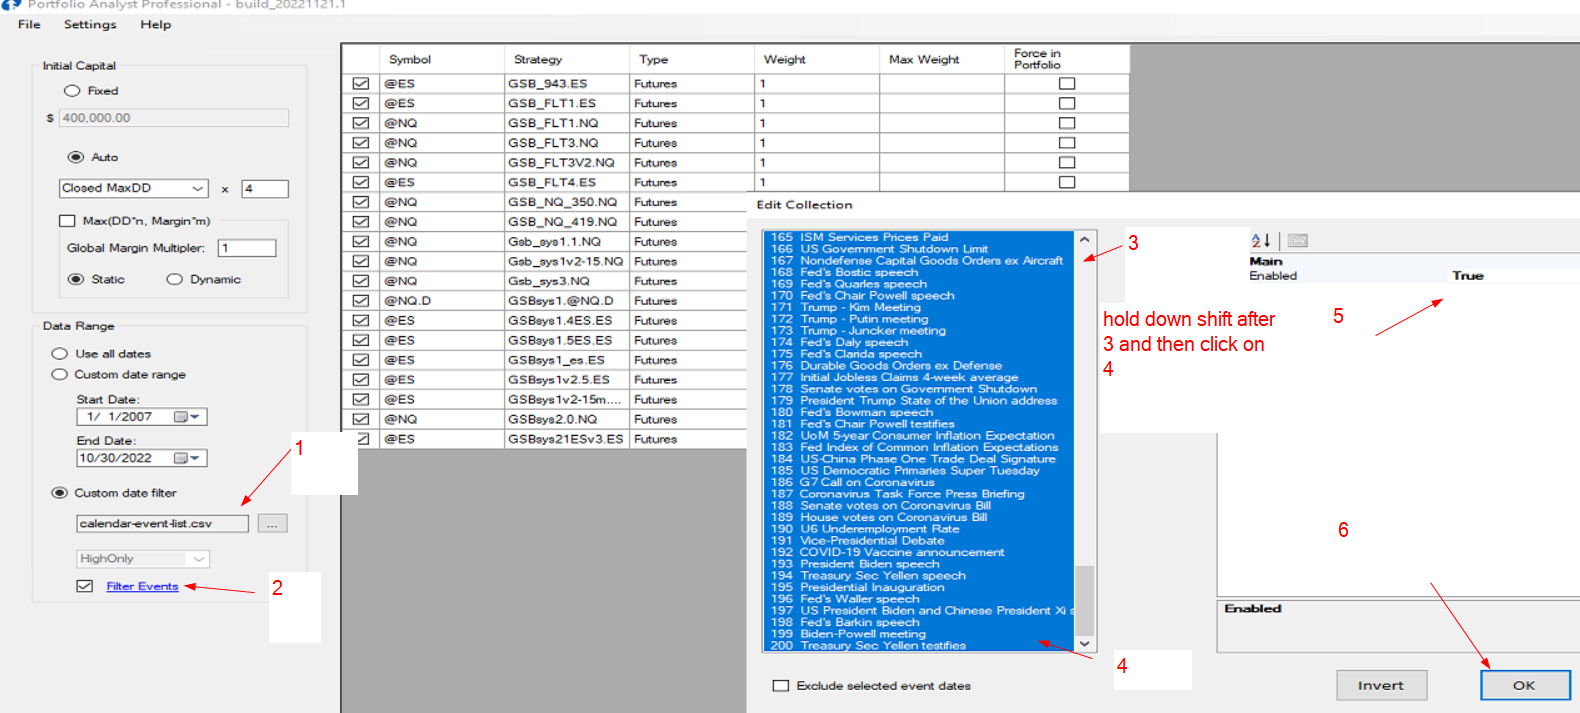
Date filter configuration for analyzing specific time periods around market events
Real-World Examples
Example 1: Building a Diversified Futures Portfolio
This example walks through building a diversified portfolio across multiple futures markets using GSB-generated systems:
- Import performance reports from multiple markets (ES, NQ, CL, GC, etc.)
- Configure initial capital based on margin requirements
- Set criteria limits to ensure diversification (max 2 systems per sector)
- Run portfolio optimization to find the best combination
- Apply Monte Carlo to validate robustness
Real-world portfolio construction example showing system selection and optimization
Example 2: Optimizing for Low Correlation
A second example focusing on minimizing portfolio correlation:
- Select systems with negative or low correlation to each other
- Use the correlation matrix to identify complementary systems
- Verify the combined equity curve is smoother than individual systems
- Check that drawdown periods don't overlap significantly
Viewing Market Performance Results
After generating a portfolio, you can click on individual systems to see standalone performance (not just portfolio-combined results). This is especially useful for evaluating recent out-of-sample results. Combine this with date filters to focus on specific time periods.
Expanded market performance view showing individual system results within the portfolio
Reference & Glossary
Key Terms
Net Profit to Drawdown Ratio
The primary optimization target in PAp. Higher ratios indicate better risk-adjusted returns.
Monte Carlo Simulation
Statistical technique that generates thousands of possible outcomes by randomly reordering trades.
Correlation Matrix
Shows how system equity curves move together. Lower correlation between systems generally provides better diversification.
Profit Factor
Gross profit divided by gross loss. Values above 1.5 are generally considered good for systematic trading.
Sharpe Ratio
Risk-adjusted return metric calculated as (return - risk-free rate) / standard deviation of returns.
Sortino Ratio
Similar to Sharpe but only considers downside volatility, making it more relevant for traders focused on drawdown risk.
Latest Updates (November 2025 Build)
- MultiCharts Support – Full support for MSA file format
- Expanded Market Performance – Click on individual systems to see standalone results
- Date Filtering – Combine with market performance for recent OOS evaluation
- Bug Fixes – Various stability and performance improvements
Pricing
- PA Pro – $400.00 USD (single license)
- PA Pro (2 copies) – $500.00 USD
- PA Pro Additional Copy – $120.00 USD
- PA Pro + EWFO Bundle – $689.98 USD (saves $210)