Robustness Lab
A comprehensive suite of statistical validation techniques that separate real edge from lucky patterns. GSB Pro applies multiple layers of rigorous testing to ensure your trading systems will perform in live markets.
What is Robustness Testing?
Robustness testing validates that your trading system contains genuine statistical edge rather than curve-fitted noise. GSB Pro applies multiple validation layers—each designed to stress-test different aspects of system performance—before any strategy touches real capital.
A robust system performs consistently across out-of-sample data, different markets, varied timeframes, and even when random noise is added to price data. Systems that pass GSB Pro's validation gauntlet demonstrate edge that survives beyond the specific conditions of the training period.
Walk-Forward Analysis
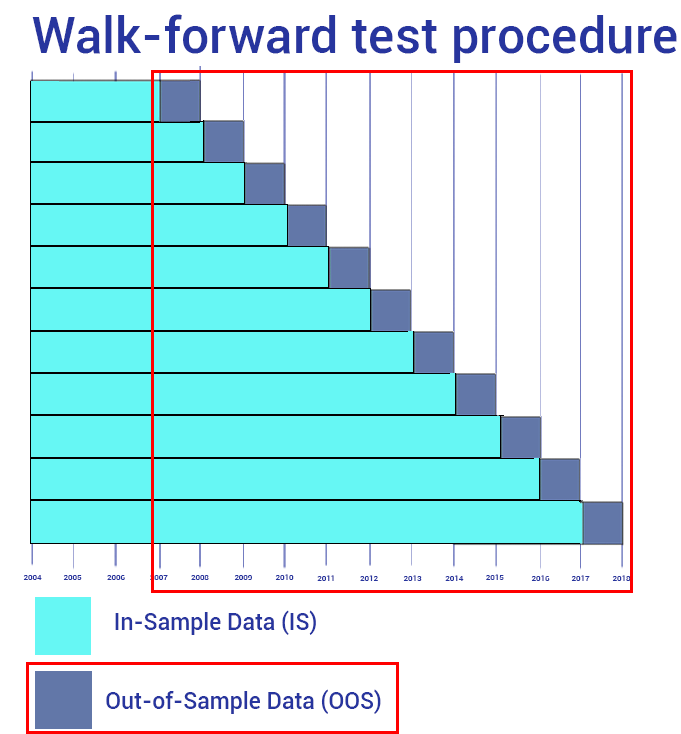
Walk-forward testing is the gold standard for trading system validation. You optimize parameters on past market data (in-sample), then test those parameters forward in time on unseen data (out-of-sample). GSB divides data into 10 overlapping segments—optimize on cyan segments, test on blue segments, repeat 10 times.
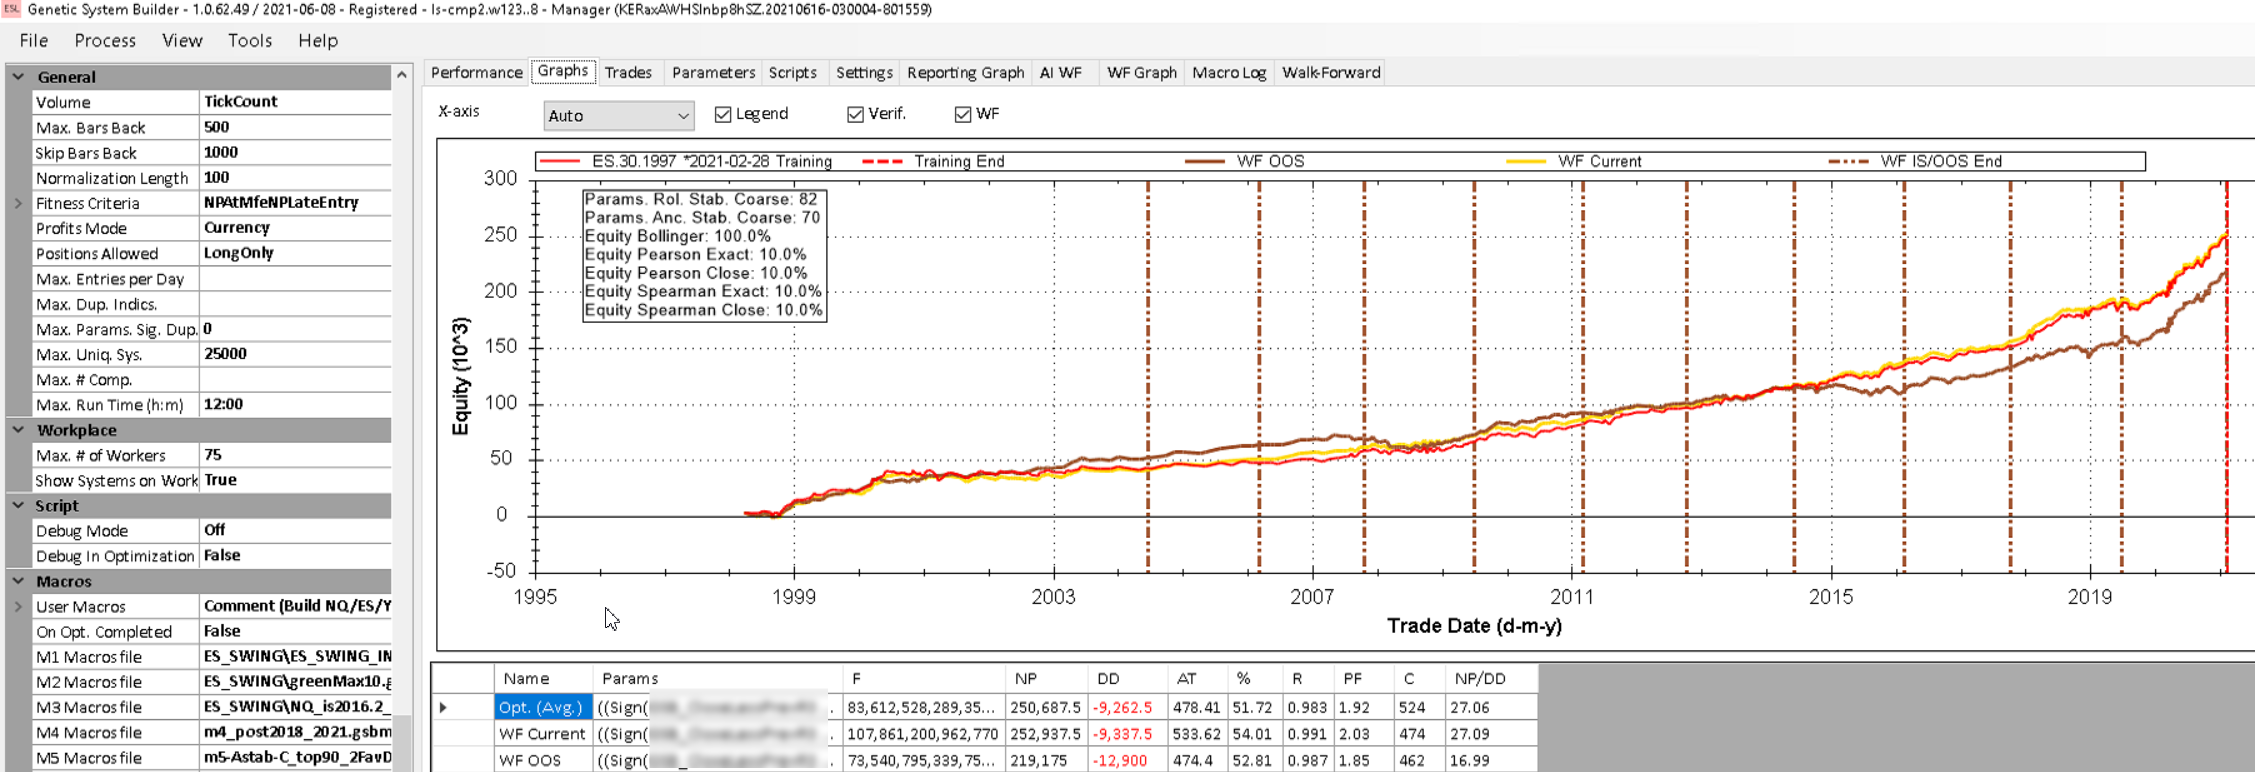
The critical insight: the out-of-sample equity curve should track above the original curve, be linear, and demonstrate that parameters aren't overfitted. If a system fails on data it hasn't seen, it won't work in live trading.
Different hold-out periods for validation
Each row shows a different way to hold out unseen data for walk-forward tests, while training on the remaining history.
Combining multiple runs for final parameters
Multiple walk-forward runs are combined in a final optimization step to select parameters that perform consistently well across different in-sample and out-of-sample windows.
Training vs OOS performance comparison
Good Signs
- OOS equity curve (brown) tracks above original (red/green)
- Linear OOS curve without dramatic deviations
- Profit factor and average trade remain stable or improve
- Walk-forward efficiency > 60% (OOS returns / IS returns)
Warning Signs
- ×OOS curve falls significantly below in-sample
- ×Highly erratic OOS equity with large drawdowns
- ×Trade count or average trade drops dramatically in OOS
- ×Walk-forward efficiency < 40% indicates overfitting
Real-World Walk-Forward Testing in GSB Pro
Here's how GSB Pro applies walk-forward analysis in practice. These authenticated screenshots show the actual walk-forward optimization setup, results, and output validation from real trading system development projects.
Walk-forward optimization dialog showing configuration of in-sample and out-of-sample periods
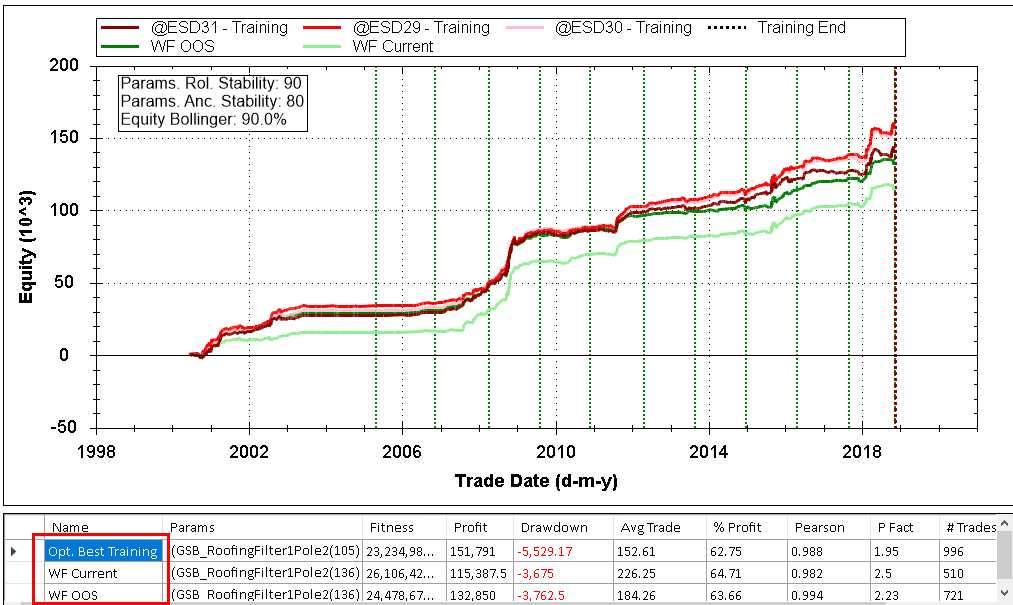
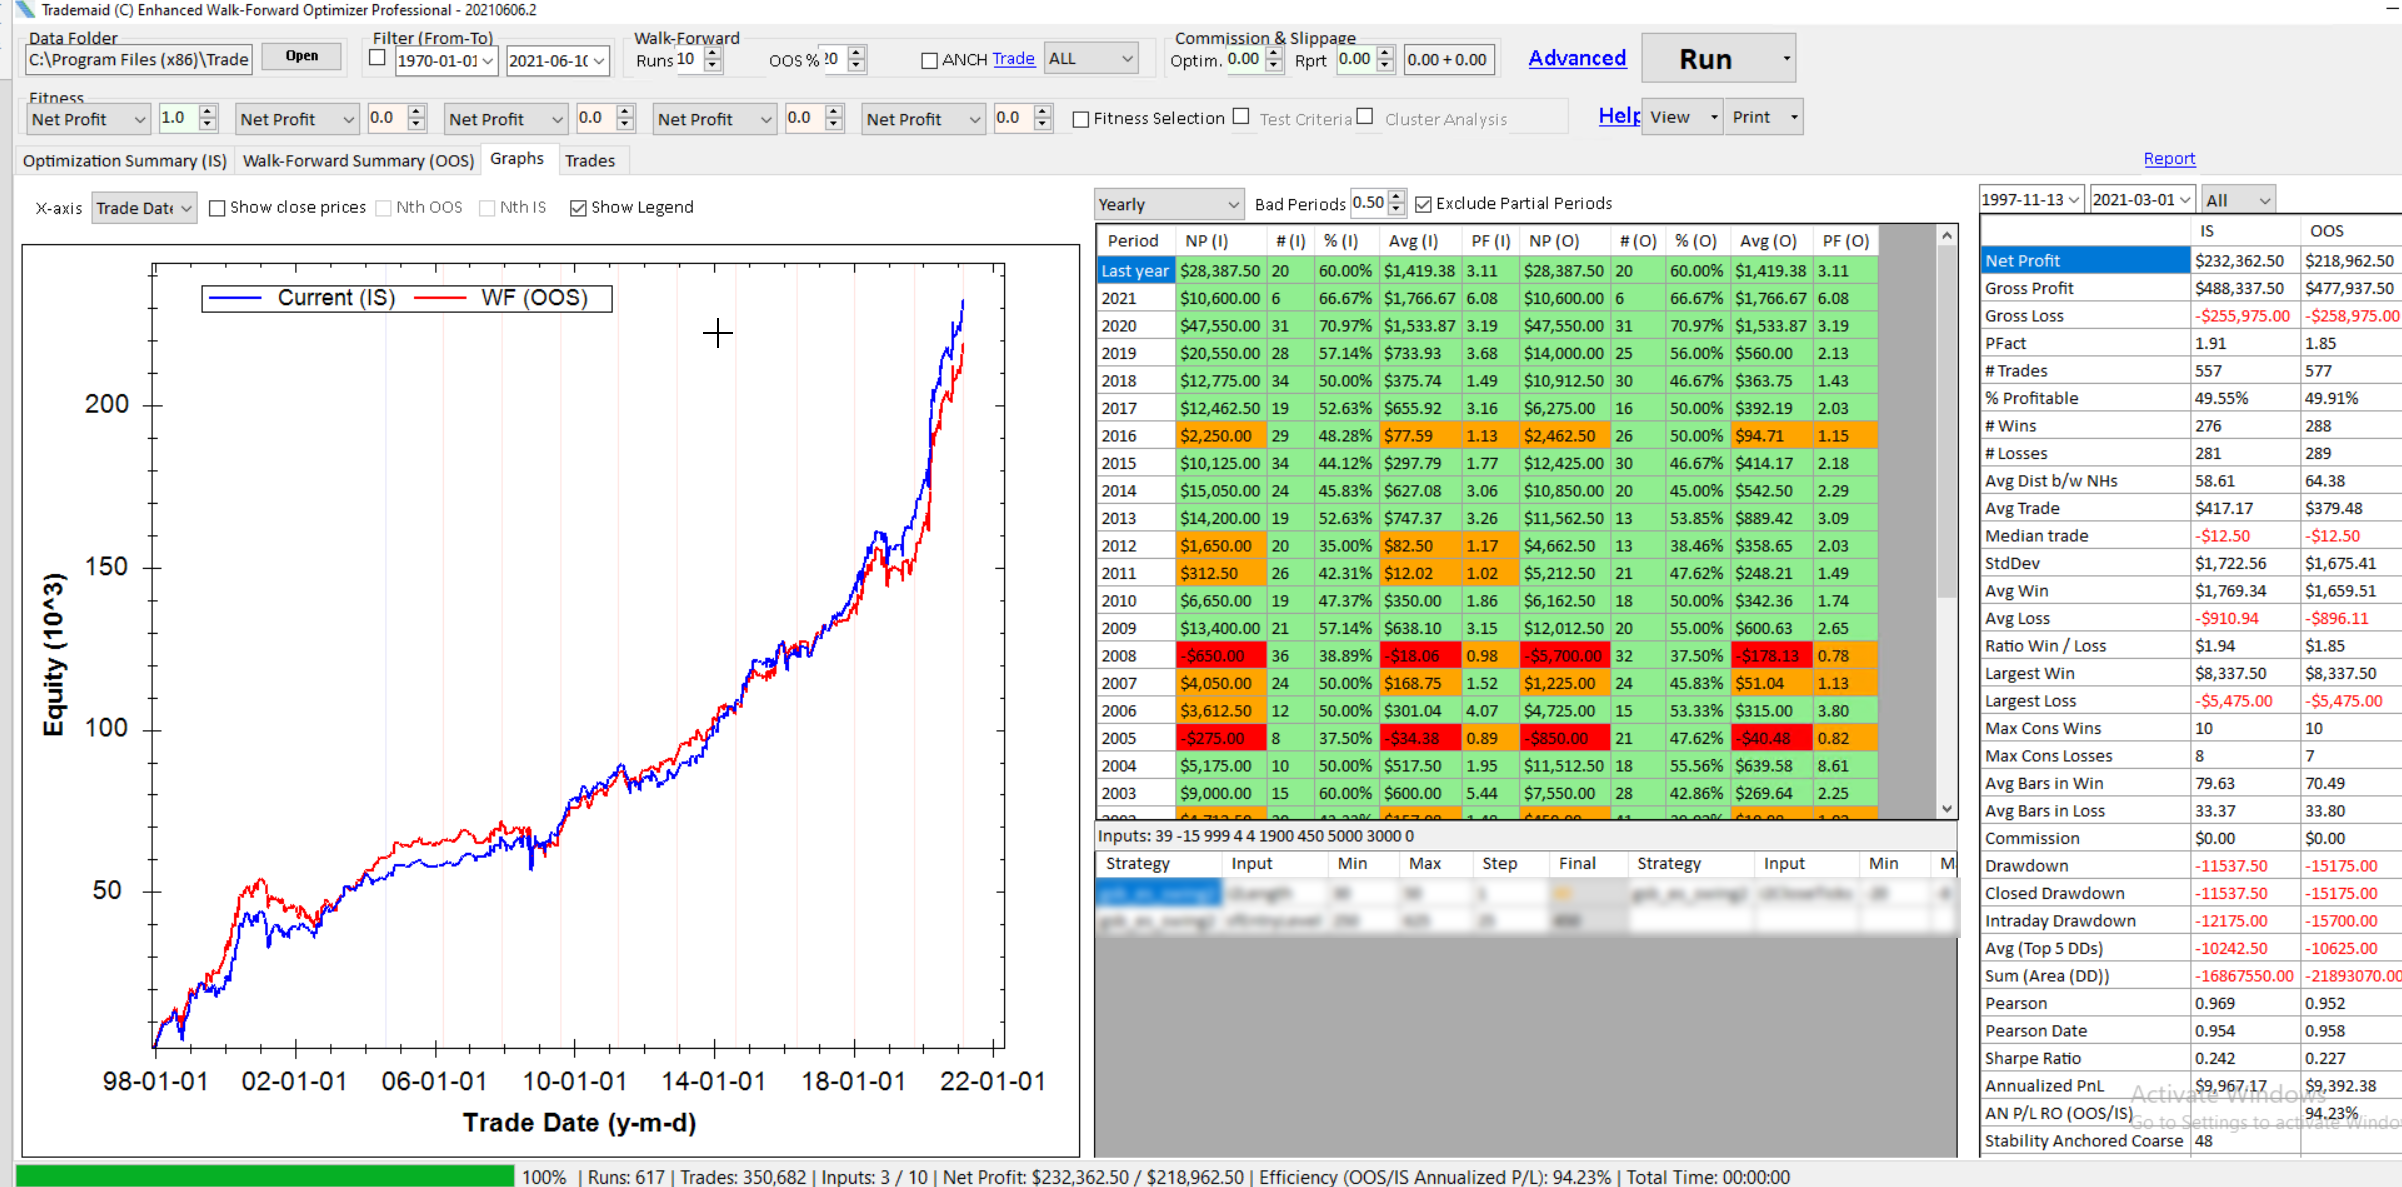
Walk-forward output metrics showing in-sample vs out-of-sample performance comparison
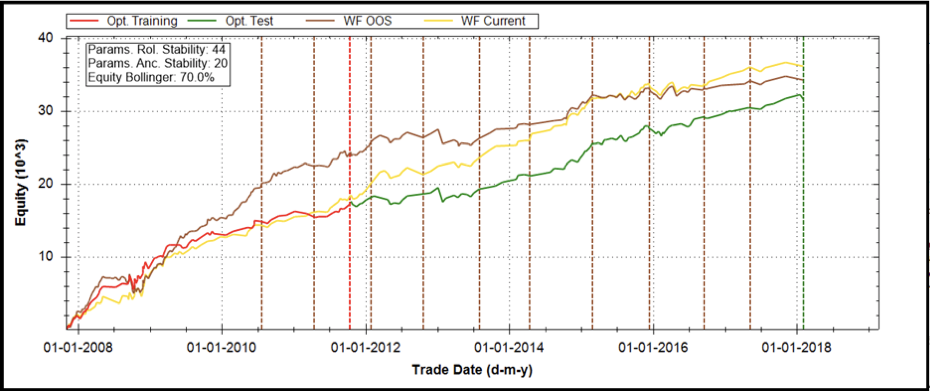
Detailed walk-forward statistics demonstrating parameter stability across multiple optimization runs
In-Sample vs Out-of-Sample Testing
Understanding how to divide your data between training and validation is fundamental to building systems that work in live trading. In-sample (IS) data is where optimization happens—the genetic algorithm searches for the best parameters. Out-of-sample (OOS) data is held back for validation—never touched during optimization to provide an honest test of robustness.
The key principle: parameters optimized on IS data must perform well on OOS data. If they don't, the system is curve-fitted to specific market conditions and will fail when deployed. Professional system developers use multiple IS/OOS testing schemes to stress-test their strategies from every angle before risking capital.
1. Basic Holdout / Classical IS-OOS Split
The simplest approach: train your system on an early block of data, then test it on a later block. This is the baseline validation method—quick to implement and easy to understand—but it only gives you one test result from one market regime.
When to Use
- • Quick initial validation of a new strategy
- • Baseline comparison before more rigorous testing
- • Sufficient data for a meaningful test period
Limitations
- • Only one test result (could be lucky or unlucky)
- • Doesn't test across multiple market regimes
- • Parameters may still be regime-specific
2. Expanding-Window / Walk-Forward Testing
Walk-forward testing (also called expanding-window evaluation or rolling origin validation) is the gold standard for trading system validation. You start with an initial training window, then progressively expand it forward in time—optimizing on increasingly larger historical datasets and testing on subsequent unseen data.
Each row shows a different way to hold out unseen data for walk-forward tests, while training on the remaining history.
Anchored vs Rolling Windows
Anchored (Expanding)
Training window grows with each period, using all prior data. Generally produces more stable parameters because it incorporates all historical regimes.
Rolling (Fixed Window)
Training window stays constant size, discarding oldest data. Useful when recent patterns matter more than distant history or when dealing with non-stationary markets.
GSB Pro's Implementation
- • Divides data into 10 overlapping periods automatically
- • Cyan segments = in-sample training data
- • Blue segments = out-of-sample validation data
- • Walk-forward efficiency > 60% indicates robust system
- • Anchored parameter stability > 40 shows consistent parameters across periods
3. Jackknife-Style Block Holdout (Segment Leave-Out)
Instead of always testing on the most recent data, this method holds out different segments of your historical dataset—at the beginning, middle, or end—and trains on everything else. By systematically leaving out blocks and testing on them, you verify the system works across different historical market regimes, not just the latest conditions.
Test 1: Hold out early period
Test 2: Hold out middle period
Test 3: Hold out recent period
Why This Matters
If your system only works when trained on 2015-2020 and tested on 2021-2023, but fails when you reverse the periods (train 2021-2023, test 2015-2020), it means your edge is regime-specific. Truly robust systems maintain positive performance regardless of which historical block you hold out for testing.
This is particularly valuable for stress-testing against crisis periods—hold out 2008-2009 or March 2020 to verify your system survives extreme volatility it wasn't trained on.
4. Days-In / Days-Out (Interleaved Sampling)
Instead of contiguous IS and OOS blocks, this technique interleaves training and testing segments throughout your entire dataset. You might use alternating days (day 1=train, day 2=test, day 3=train, day 4=test) or longer blocks (80 days train, 80 days test, repeating). This creates multiple scattered out-of-sample tests across different time periods.
Important: Robustness Testing Only
Days-in/days-out is NOT recommended for primary validation because it can introduce subtle look-ahead bias—training data from the future could influence parameter selection. Use this method as a supplementary robustness check, not your main validation approach. Walk-forward testing remains the gold standard.
Alternating Days (Day-On / Day-Off)
Every other day reserved for testing. Creates maximum diversity of test conditions but higher risk of temporal leakage.
80 Days On / 80 Days Off
Larger blocks reduce temporal leakage compared to single days. Common for swing systems where 80 days represents ~4 months of data.
30 Days On / 30 Days Off
Balanced approach for day-trading systems. Each month alternates between training and validation.
Entries: Restricted to "In" Segments Only
The system can only initiate new trades during the designated training days/blocks. This is where optimization occurs and new positions are opened.
Exits: Use Full Dataset
Open positions can be exited on any day, including "out" days. This ensures realistic trade management—you can't refuse to close a trade just because it's a test day. The exit logic must work across the entire dataset.
5. Training / Validation / Test Splits (Three-Stage Workflow)
Professional machine learning workflows use three distinct datasets to prevent overfitting: training for optimization, validation for model selection, and test for final evaluation. Trading system development benefits from the same discipline—especially when comparing multiple strategies or tuning validation thresholds.
50-60% of data
Where genetic algorithm optimization occurs. Parameters are fitted to maximize performance on this period.
Example: 2010-2016
20-25% of data
Used to select between competing systems and tune verification thresholds without "peeking" at the final test.
Example: 2017-2019
20-25% of data
Completely untouched final evaluation. If system performs well here, you have confidence it will work live.
Example: 2020-2023
Ideal Scenarios
- • Comparing multiple indicator sets or logic variations
- • Tuning walk-forward efficiency thresholds
- • Selecting between different entry/exit approaches
- • Building portfolio of systems (use validation to pick winners)
- • Abundant data (15+ years) allows clean three-way split
Implementation Tips
- • Never re-optimize after seeing test set results
- • Use validation set to tune filters (profit factor, trades, etc.)
- • Test set should remain locked until final decision time
- • Can combine with walk-forward: 10-period WF on training, single test on validation, final check on test
Practical Example: You build 50,000 systems using genetic algorithms on 2010-2016 data (training). You then filter them using walk-forward tests on 2017-2019 (validation) to identify the top 20 systems. Finally, you verify those 20 candidates on 2020-2023 (test) to select your portfolio for live trading. The test set gives you an unbiased estimate of real-world performance because it was never touched during any selection decision.
6. Practical Guidance & Best Practices
Using multiple validation schemes provides far more confidence than any single approach. Professional developers layer these techniques to stress-test systems from every angle:
Recommended Workflow
- Start with basic holdout: Quick initial validation (70/30 split)
- Run 10-period walk-forward: Gold standard test across market regimes
- Test jackknife-style blocks: Hold out crisis periods (2008, 2020) to verify robustness
- Optional days-in/days-out: Supplementary stress test for temporal dependencies
- Final locked test set: 20% completely untouched data for final go/no-go decision
Red Flags to Avoid
- ×Re-optimizing after seeing OOS results (this converts OOS into IS)
- ×Using only one simple train/test split for final decision
- ×Testing on data temporally close to training (leaves gap of 1-2 weeks minimum)
- ×Cherry-picking which OOS period to report (test on all periods)
- ×Relying solely on days-in/days-out for primary validation
Ideally the ratio of out-of-sample to in-sample net profit should be within ±20%. This indicates realistic parameter selection without overfitting or underutilization.
Look for anchored parameter stability scores > 40 in GSB Pro. Higher scores indicate parameters remain consistent across optimization periods—a sign of genuine robustness rather than regime-specific fitting.
Cluster Analysis
Enhanced Walk Forward Optimizer
Cluster Analysis is an advanced validation feature available in the Enhanced Walk Forward Optimizer (EWFO), a separate tool in the GSB ecosystem. Learn more about EWFO →
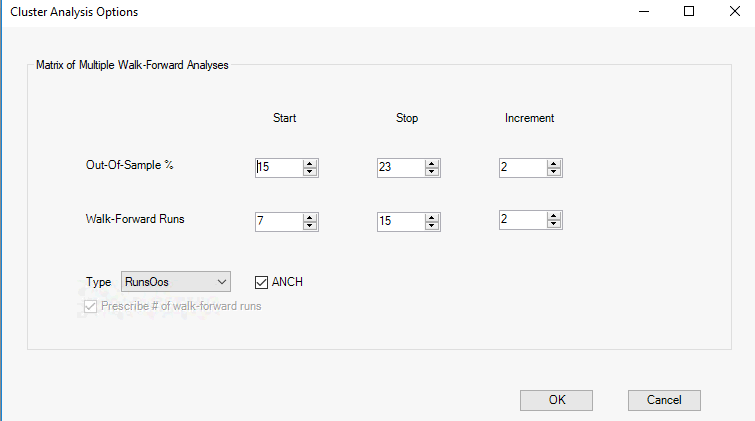
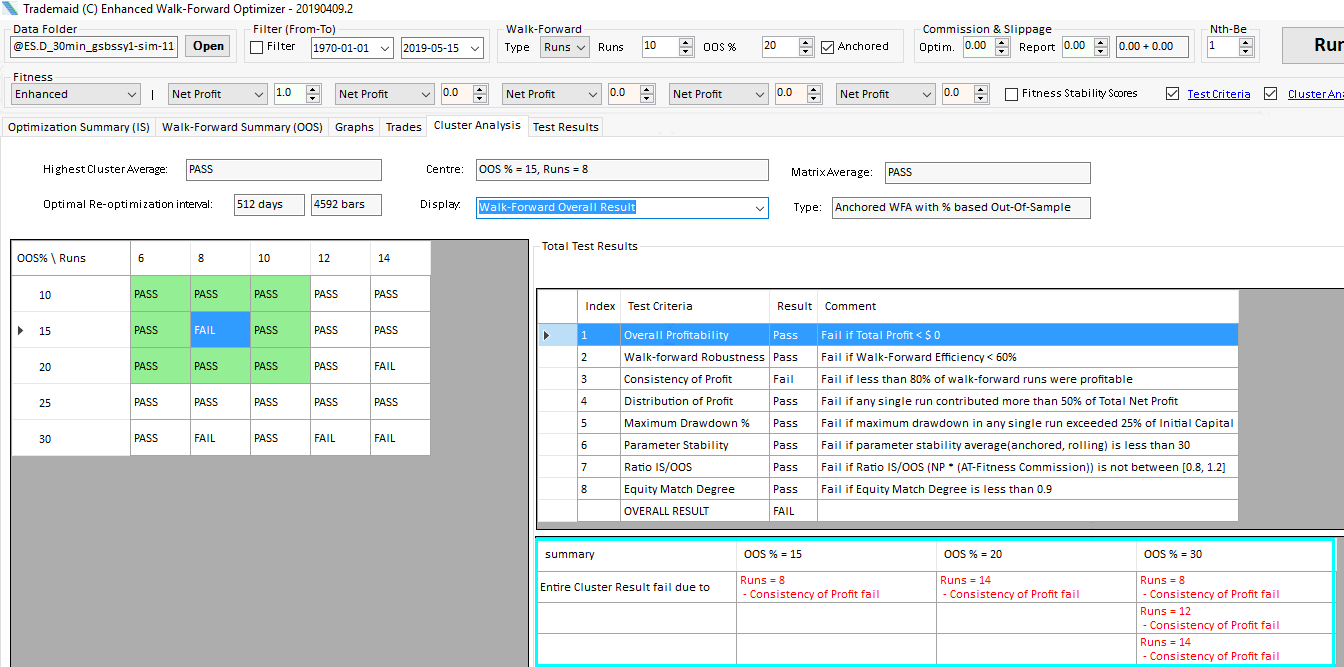
Cluster analysis stress-tests your system by running 25 separate walk-forward optimizations with parameter variations. Instead of relying on a single WF result, you verify that the system performs well across a range of similar configurations. A robust system should show profitable results in at least 8 cells near the center of the parameter cluster.
This technique reveals whether you've found a genuine edge or just one lucky parameter combination. Systems with 15-20+ successful cluster cells are significantly more robust than those with only 8. It's the difference between a system that works because the parameters are special versus a system that works because the underlying logic is sound.
Test criteria and settings for 25-run cluster validation
Profitability Requirements
- • Each WF run should be profitable (> $0 net profit)
- • Walk-forward efficiency should be > 60%
- • 8 out of 10 WF periods must be profitable
- • No single run contributes > 50% of total profit
Risk Management
- • Maximum drawdown of any run < 25% of initial capital
- • No single loss period contributes > 25% of total loss
- • OOS trades should be ≥80% of IS trade count
- • Average trade size should remain consistent
Parameter Stability
- • Anchored parameter stability > 40 recommended
- • Final parameters close to all previous parameters
- • Parameter consistency indicates robust edge
- • Lower score when using rolling vs anchored WF
Cluster Success
- • Minimum 8 successful cells (basic robustness)
- • 15-20 successful cells (good robustness)
- • 25 successful cells (excellent robustness)
- • Successful cells should cluster near center
Matrix showing successful/failed parameter combinations
Multi-Market Validation
Multi-market validation tests whether your system captures broad market behavior or is simply fitted to one specific instrument. A truly robust system should perform reasonably well on related markets—not necessarily with identical profitability, but with consistent logic and positive returns.
For example, an S&P 500 system might be validated on the Nasdaq, Dow, or Russell 2000. A crude oil system could be tested on heating oil or unleaded gas. Systems that completely fail on related markets are likely curve-fitted to the peculiarities of a single contract rather than capturing genuine trading patterns.
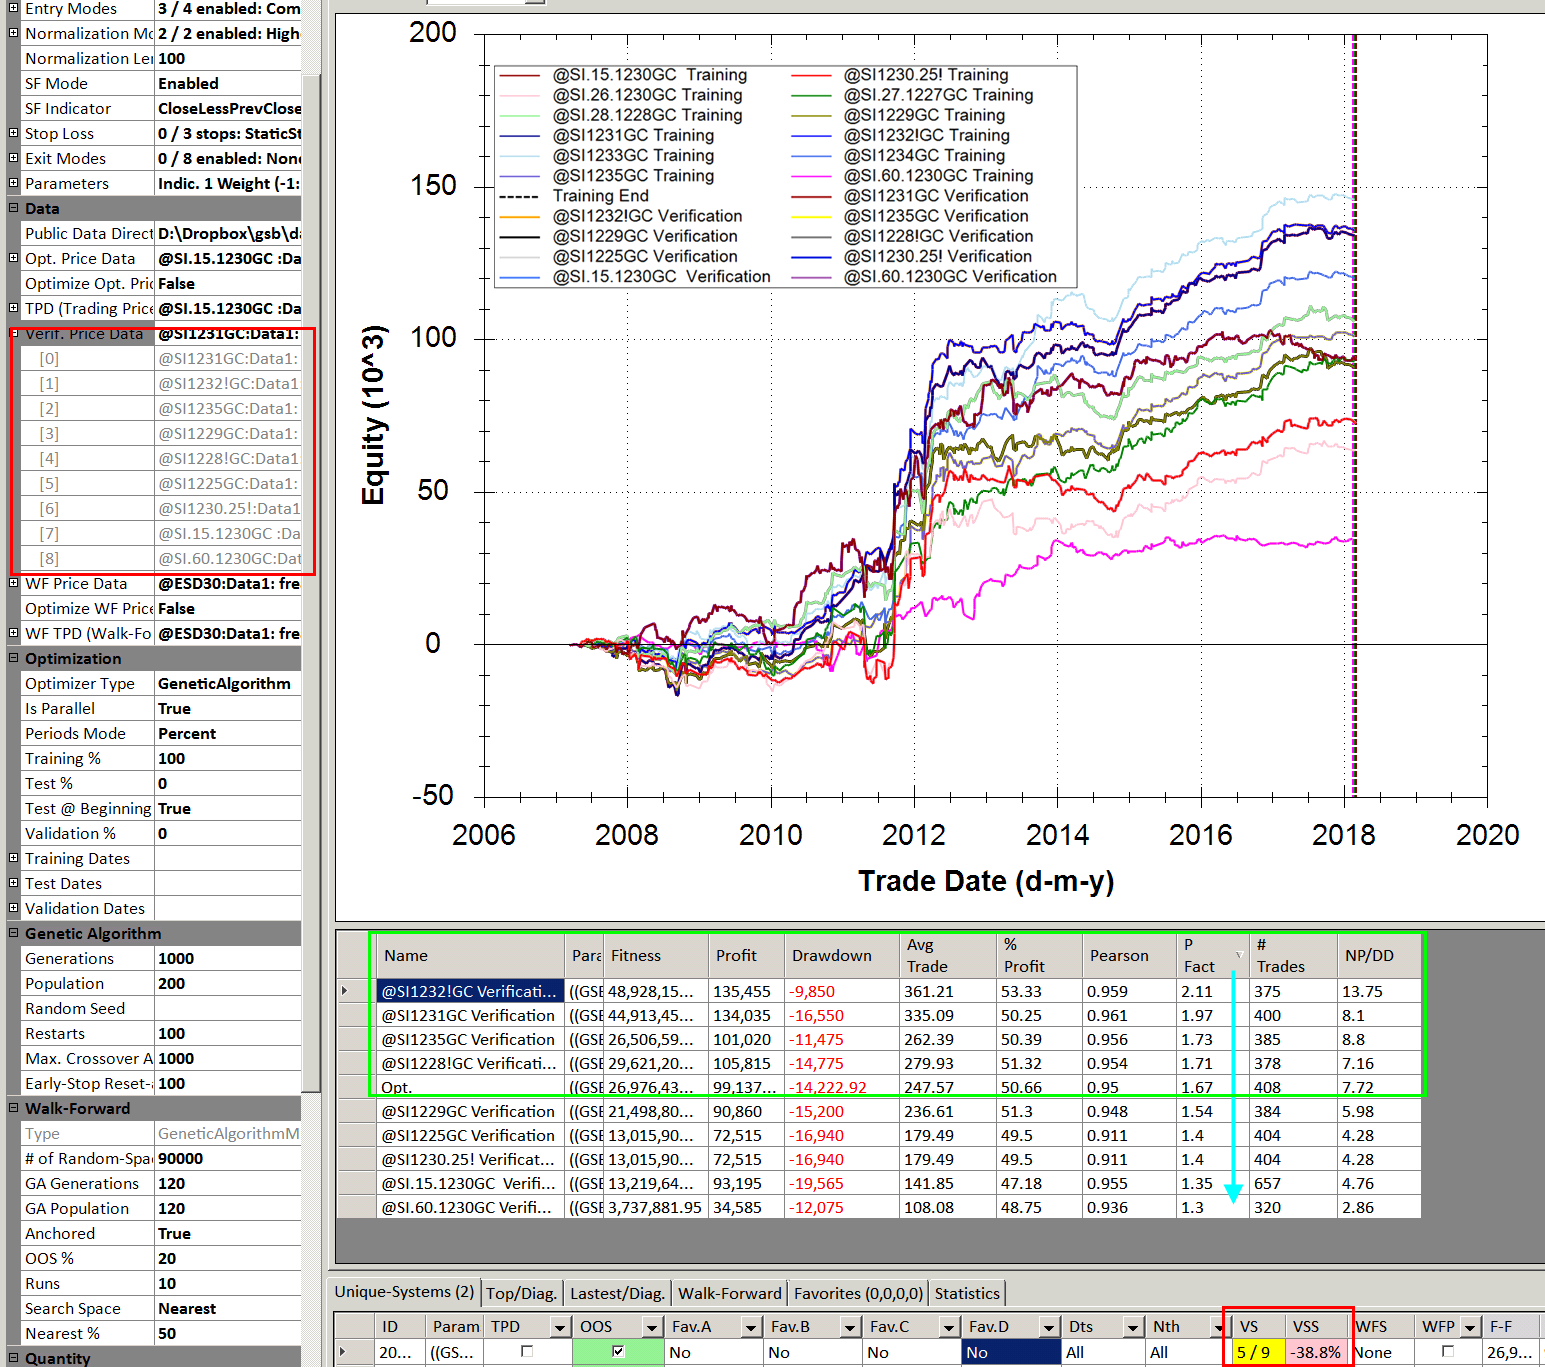
SI (Silver) contracts across different expirations • 2006-2020 walk-forward testing
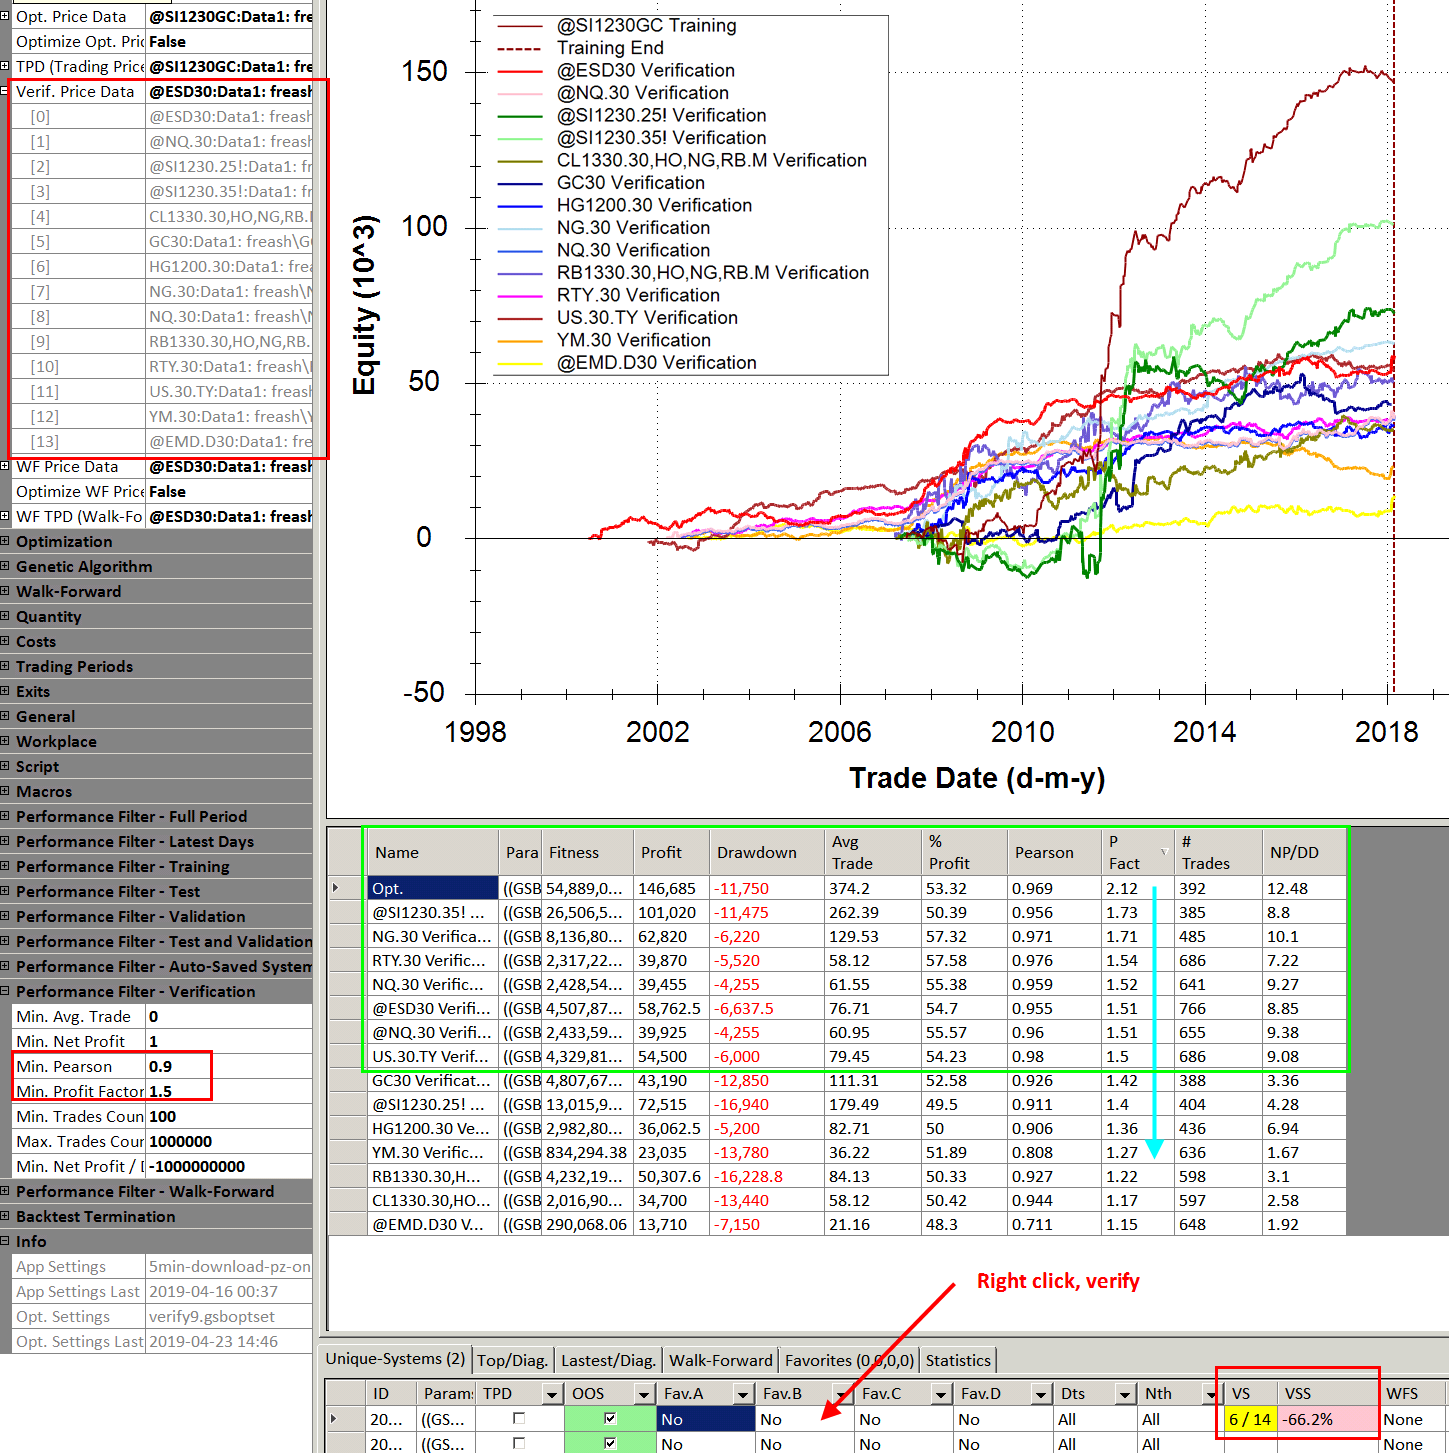
ES, NQ, CL, GC, HG, NG, RB, RTY, US, YM, EMD • 1998-2018 full history validation
Equity Indices
S&P 500 (@ES): Test on NQ, YM, RTY, EMD
Nasdaq (@NQ): Test on ES, EMD, YM
Dow (@YM): Test on ES, NQ, RTY
Commodities & Energy
Crude Oil (@CL): Test on RB, HO, NG
Gold (@GC): Test on SI, HG, PL
Natural Gas (@NG): Test on CL, RB
Implementation: Right-click a system in GSB → Verify → Select related markets as Data2. Systems that maintain positive performance across 3+ related markets demonstrate genuine pattern recognition rather than market-specific curve fitting.
Multi-Timeframe Validation
Multi-timeframe validation tests your system across different bar intervals to verify it isn't optimized to the specific number of bars per day. Instead of building on just 30-minute bars, GSB can use 29, 30, and 31-minute intervals—creating 12, 11, and 10 bars per day respectively—to stress-test the oscillators and reduce curve-fitting tendencies.
The logic: if your system only works with exactly 11 bars per day (330 minutes ÷ 30 min bars), it's probably overfit to that specific bar count. A robust system should maintain positive performance when tested on 25-35 minute bars, demonstrating that the edge isn't dependent on precise bar intervals.
Build Configuration
29-Minute Bars
12 bars per day (348 min trading)
330 ÷ 29 = 11.38
30-Minute Bars
11 bars per day (330 min trading)
Standard configuration
31-Minute Bars
10 bars per day (310 min trading)
330 ÷ 31 = 10.64
Verification Timeframes
After building on 29/30/31 minute bars, verify systems on an extended range:
Systems passing verification across 8+ timeframes demonstrate genuine robustness beyond bar-interval fitting.
Implementation Notes
- • Load 1-minute base data, then create multiple streams with different multipliers (29×1min, 30×1min, 31×1min)
- • Building on multiple timeframes is slower and uses more RAM (~10GB per worker)
- • Set
GeneticTimeFrameSelection=trueto let GSB choose best timeframe automatically - • For walk-forward, use the central timeframe (30 min) for WF testing even if built on multiple
Noise Testing & Robustness Verification
Noise testing adds random tick variations to price data to test whether your system survives small perturbations. If a system only works with exact historical prices and fails when ±4 ticks of randomness are added, it's overfit to specific price levels rather than capturing genuine patterns.
GSB recommends adding 4 data streams with 5 ticks of random noise and 4 streams with 10 ticks of noise. Systems that pass verification with random noise demonstrate they're robust to real-world conditions like slippage, bid-ask spread variations, and minor data feed differences.
Configure clones and tick variations
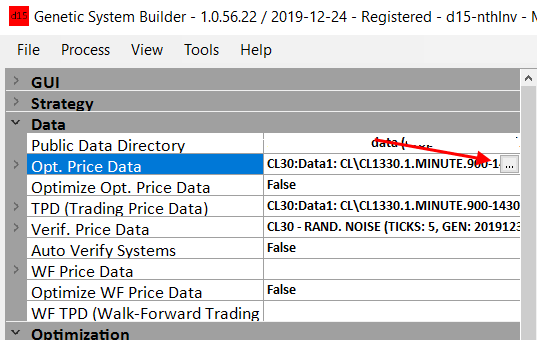
Set clones=4, ticks=5 for first set
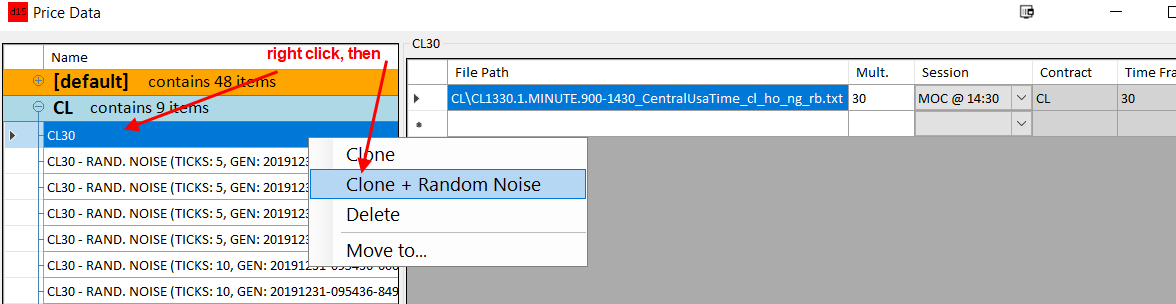
Step-by-Step Configuration
- In Data Manager, when loading verification data, set Clones = 4 and Ticks = 5
- This creates 4 data streams with ±4 ticks of random variation
- Repeat the process with Ticks = 10 for a second set of 4 streams (±8 ticks)
- Processing takes ~1 minute per set to generate randomized data
- Select all verification data streams and click OK
Why This Works
Adding random noise simulates real-world trading conditions: slippage, bid-ask bounce, minor data feed differences, and price volatility. Systems that survive noise testing will handle live market conditions better.
VSS vs VS Scoring
VSS (Verify System Score) measures average degradation across all verification data. VS counts how many verification streams pass performance filters. VSS is generally preferred.
Default thresholds: Profit Factor 1.8, Pearson 0.85
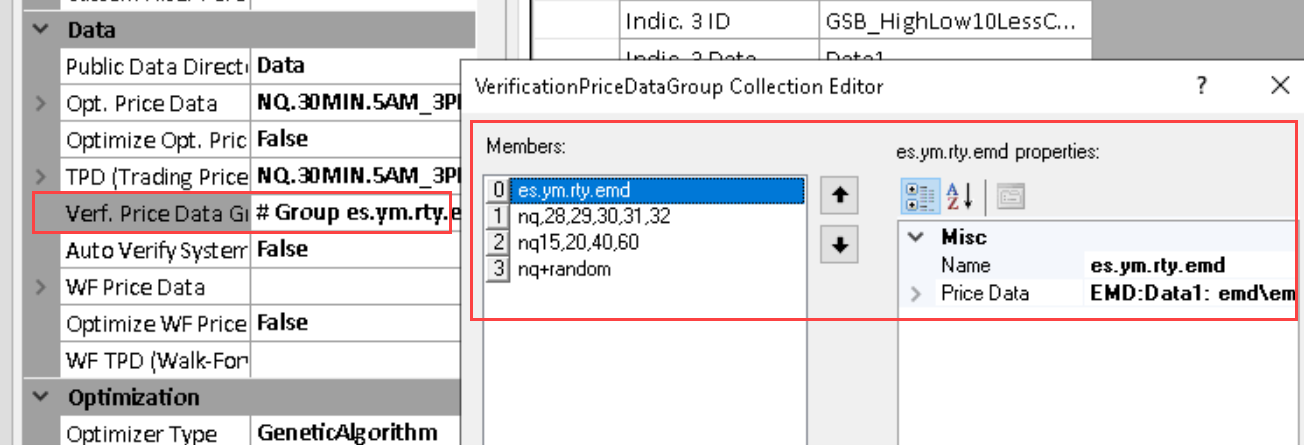
Monte Carlo Confidence Intervals
Portfolio Analyst Pro
Monte Carlo analysis is an advanced validation feature available in Portfolio Analyst Pro, a separate tool in the GSB ecosystem. Learn more about Portfolio Analyst Pro →
Portfolio Analyst Pro uses Monte Carlo analysis to project your systems across thousands of different trade sequence scenarios. See confidence bands showing 5%, 50%, and 95% outcome ranges—not just one optimistic backtest result.
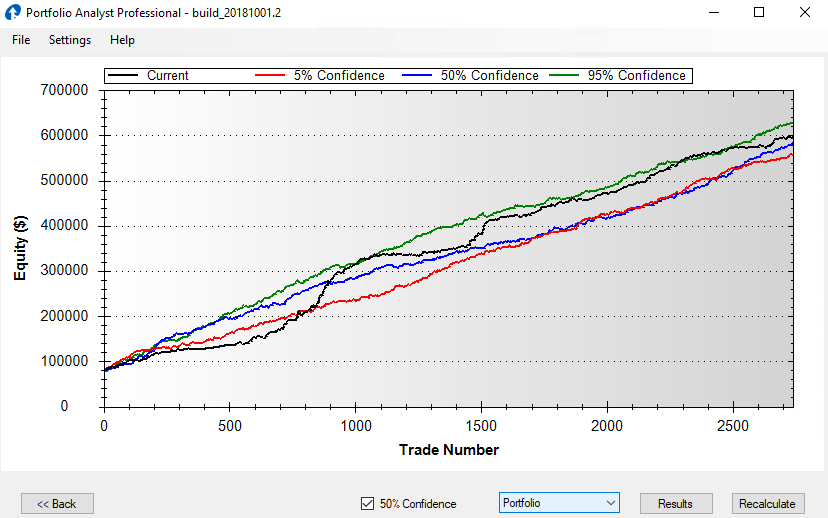
Monte Carlo simulation randomly reorders your historical trades thousands of times to generate a distribution of possible outcomes. This reveals whether your backtest result was typical or an outlier.
What It Reveals
- • Range of likely returns (not just one curve)
- • Probability of drawdown scenarios
- • Consistency of performance across sequences
- • Risk of consecutive losing trades
Good vs Bad Signs
- ✓ Narrow confidence bands = consistent performance
- ✓ 50th percentile close to backtest = typical result
- × Wide bands = luck-dependent outcomes
- × Backtest near 95th percentile = unrealistic expectation
Statistical Validation Against Random Baselines
GSB Pro doesn't just find patterns—it validates that your indicators actually beat random chance. Every indicator is tested against randomized baselines to ensure statistical significance.
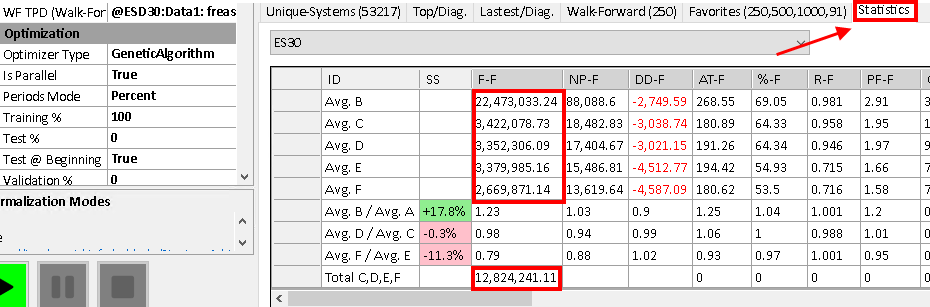
Complete Robustness Workflow
Every trading system discovered through GSB Pro passes through multiple validation stages. This systematic approach filters out lucky patterns and identifies genuine edge before any strategy touches real capital.
Filters Out Luck
By testing at multiple stages—walk-forward, multi-market, noise testing, and optionally cluster analysis (EWFO)—the GSB ecosystem ensures only indicators with genuine statistical edge survive the process. Lucky patterns fail somewhere along the validation chain.
Validates With Real Data
Walk-forward optimization tests performance on out-of-sample data that was never touched during parameter selection. Random baseline comparisons confirm your systems aren't just fitting noise.
Stress Tests Everything
Systems are verified against randomized data with added noise, tested on related markets, and validated across multiple timeframes. Portfolio Analyst Pro then applies Monte Carlo analysis to project performance across thousands of scenarios.
Continuous Refinement
Each stage compares against previous baselines. Only improvements are kept. Your final systems represent the best survivors of multiple discovery and validation cycles, battle-tested against every robustness criterion.
The Result: Confidence Before Deploying Capital
Systems that pass all validation stages have been tested more rigorously than most professionally managed strategies. You know they work on unseen data, survive parameter variations, perform across related markets and timeframes, and handle noise and slippage. Advanced tools like EWFO's cluster analysis and Portfolio Analyst Pro's Monte Carlo projections provide additional confidence layers. This comprehensive validation gives you certainty that your edge is real—not luck.
Real Results from Validated Systems
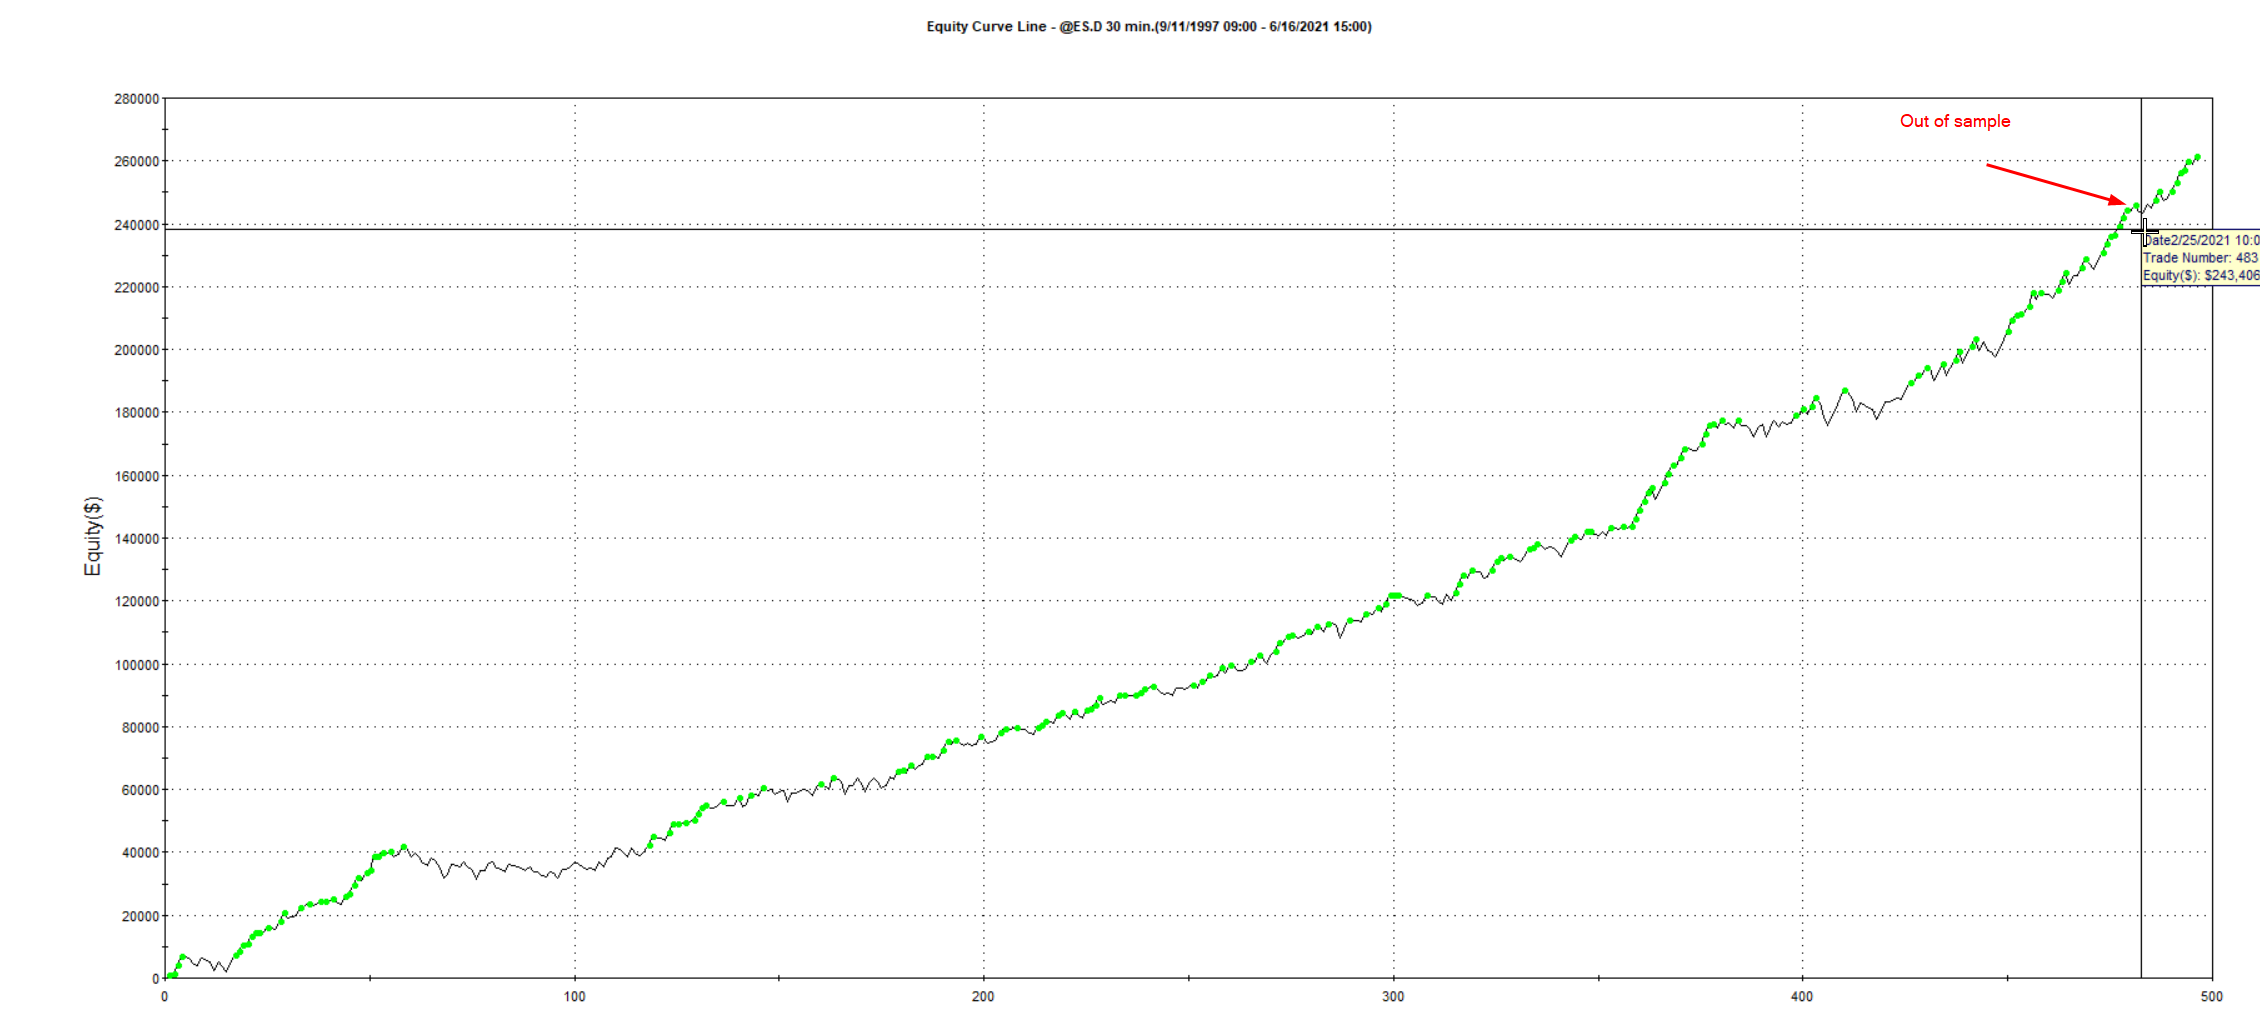
These equity curves represent trading systems that survived GSB Pro's rigorous validation process. Consistent growth across out-of-sample periods and robust performance across different market conditions.
E-mini Nasdaq • Validated with out-of-sample performance
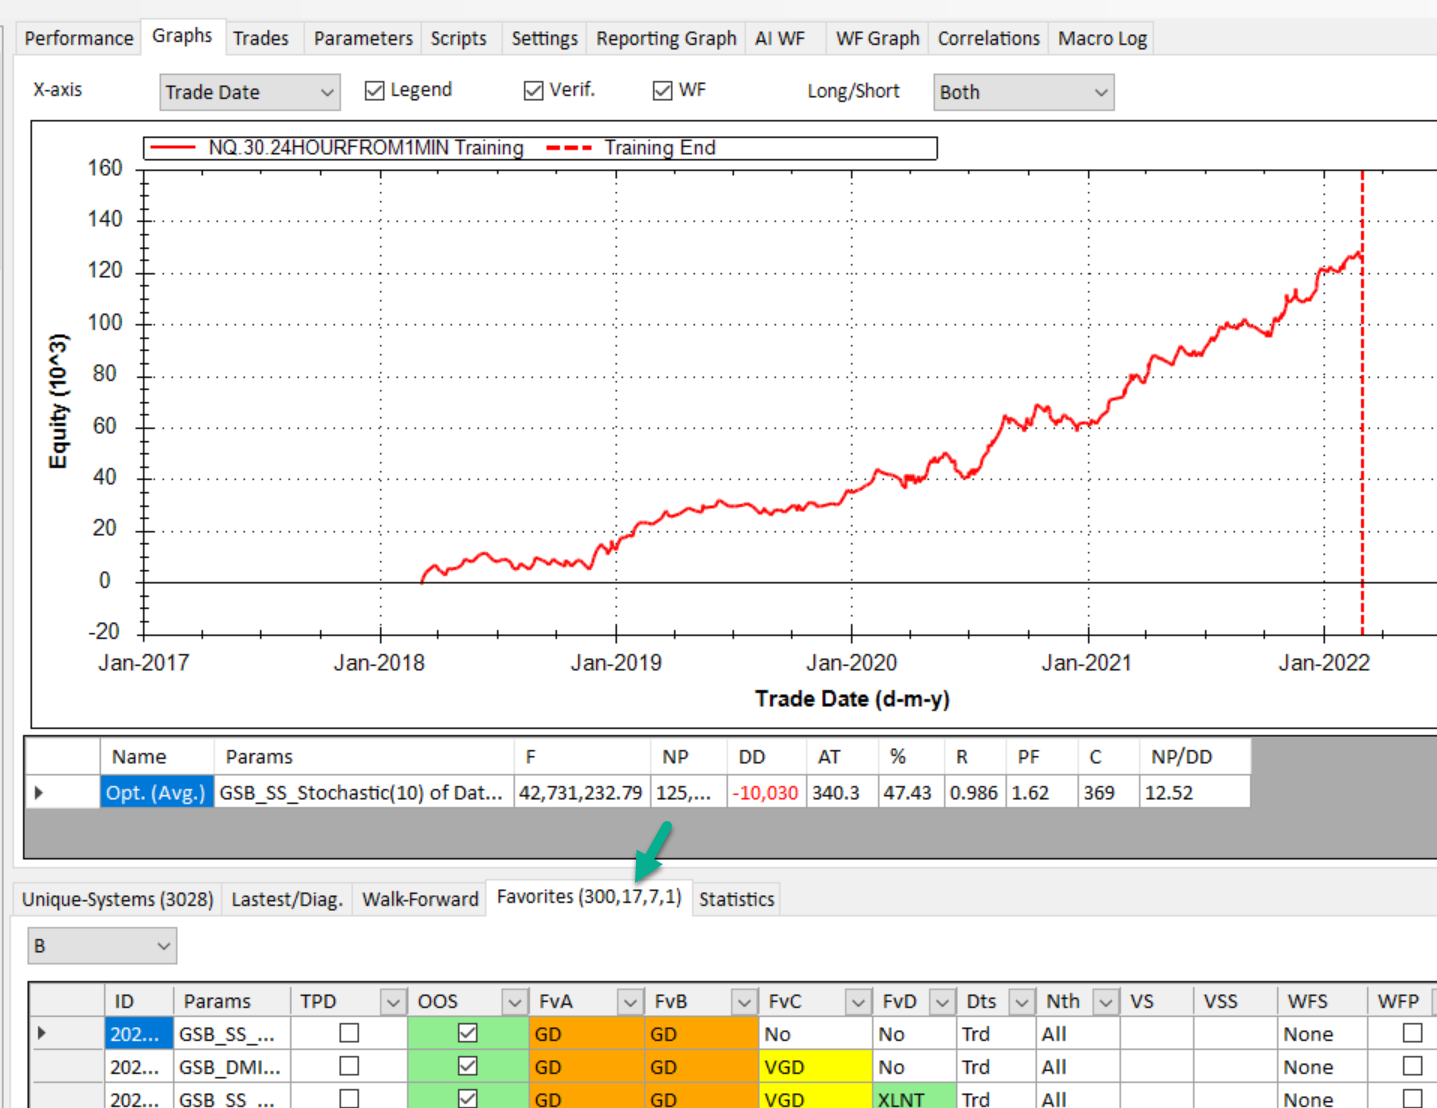
Crude Oil Futures • Long-term validated performance
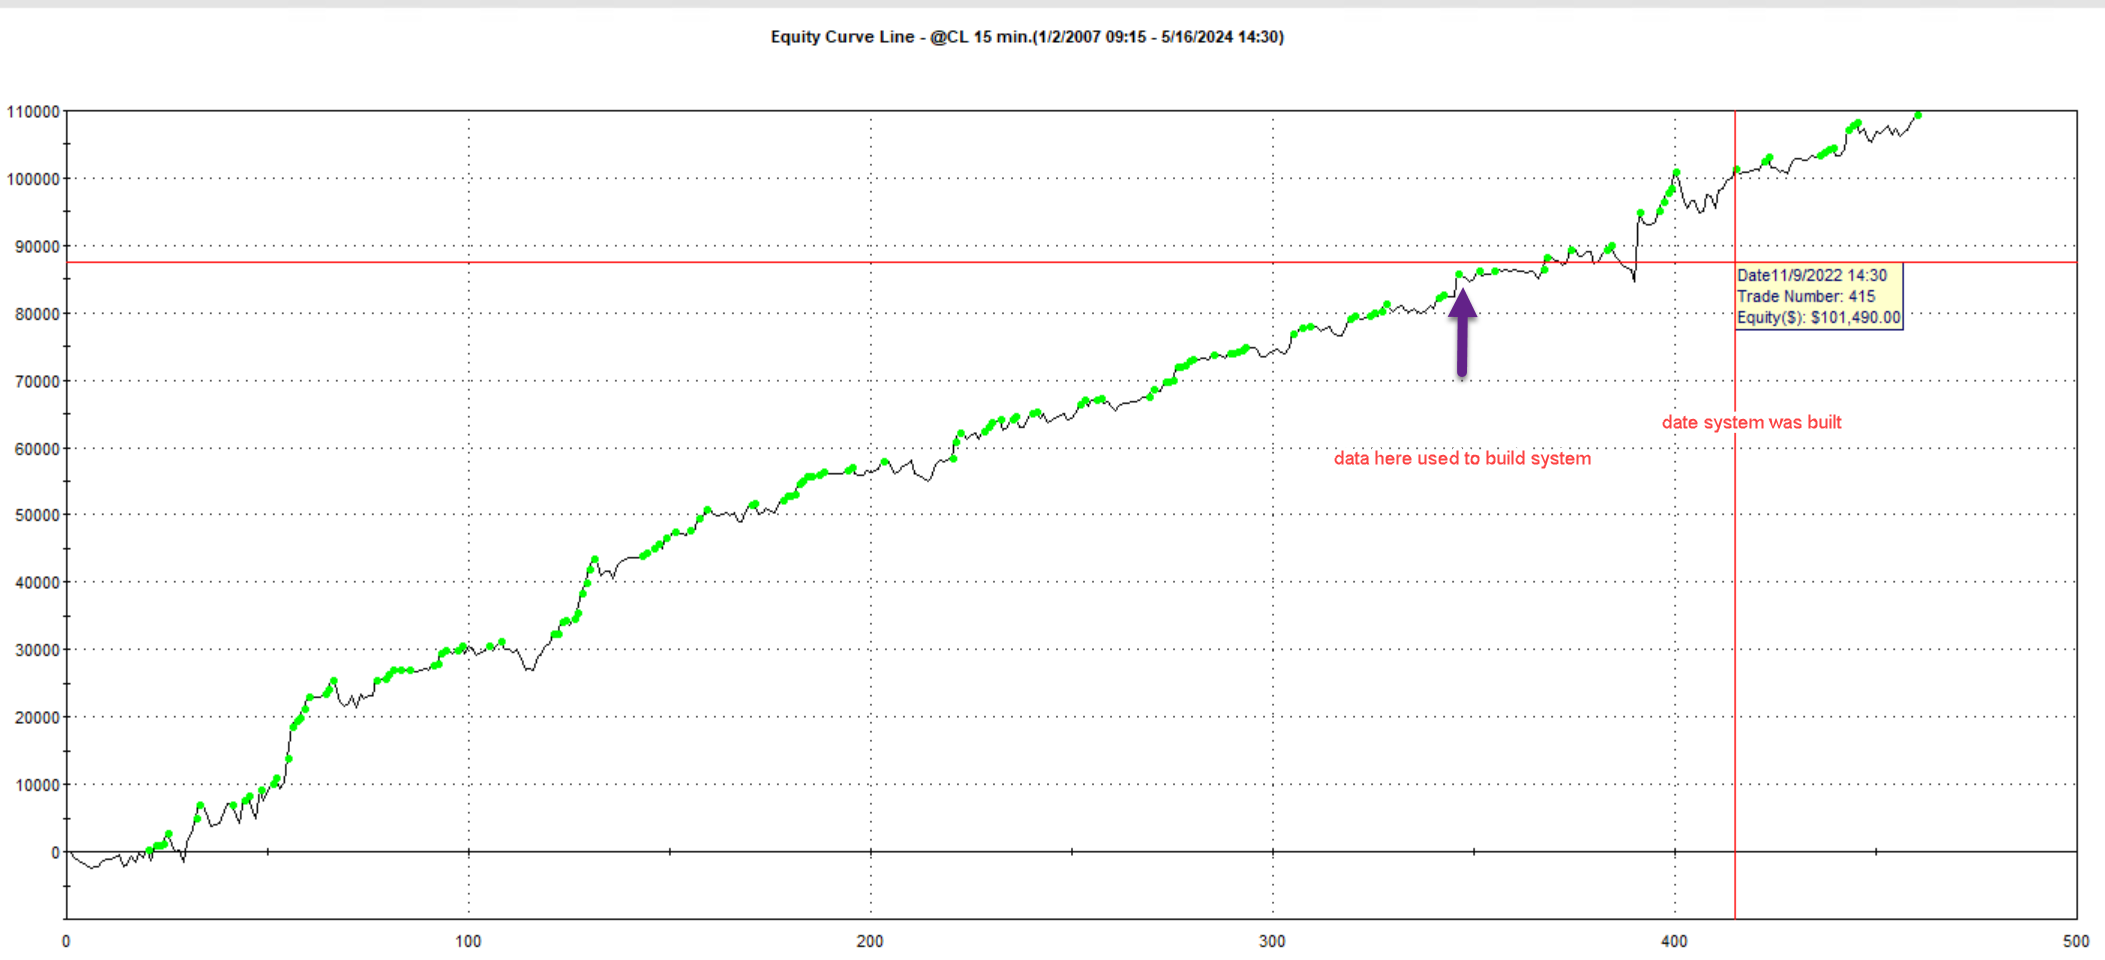
Clear training/testing boundary • Consistent growth
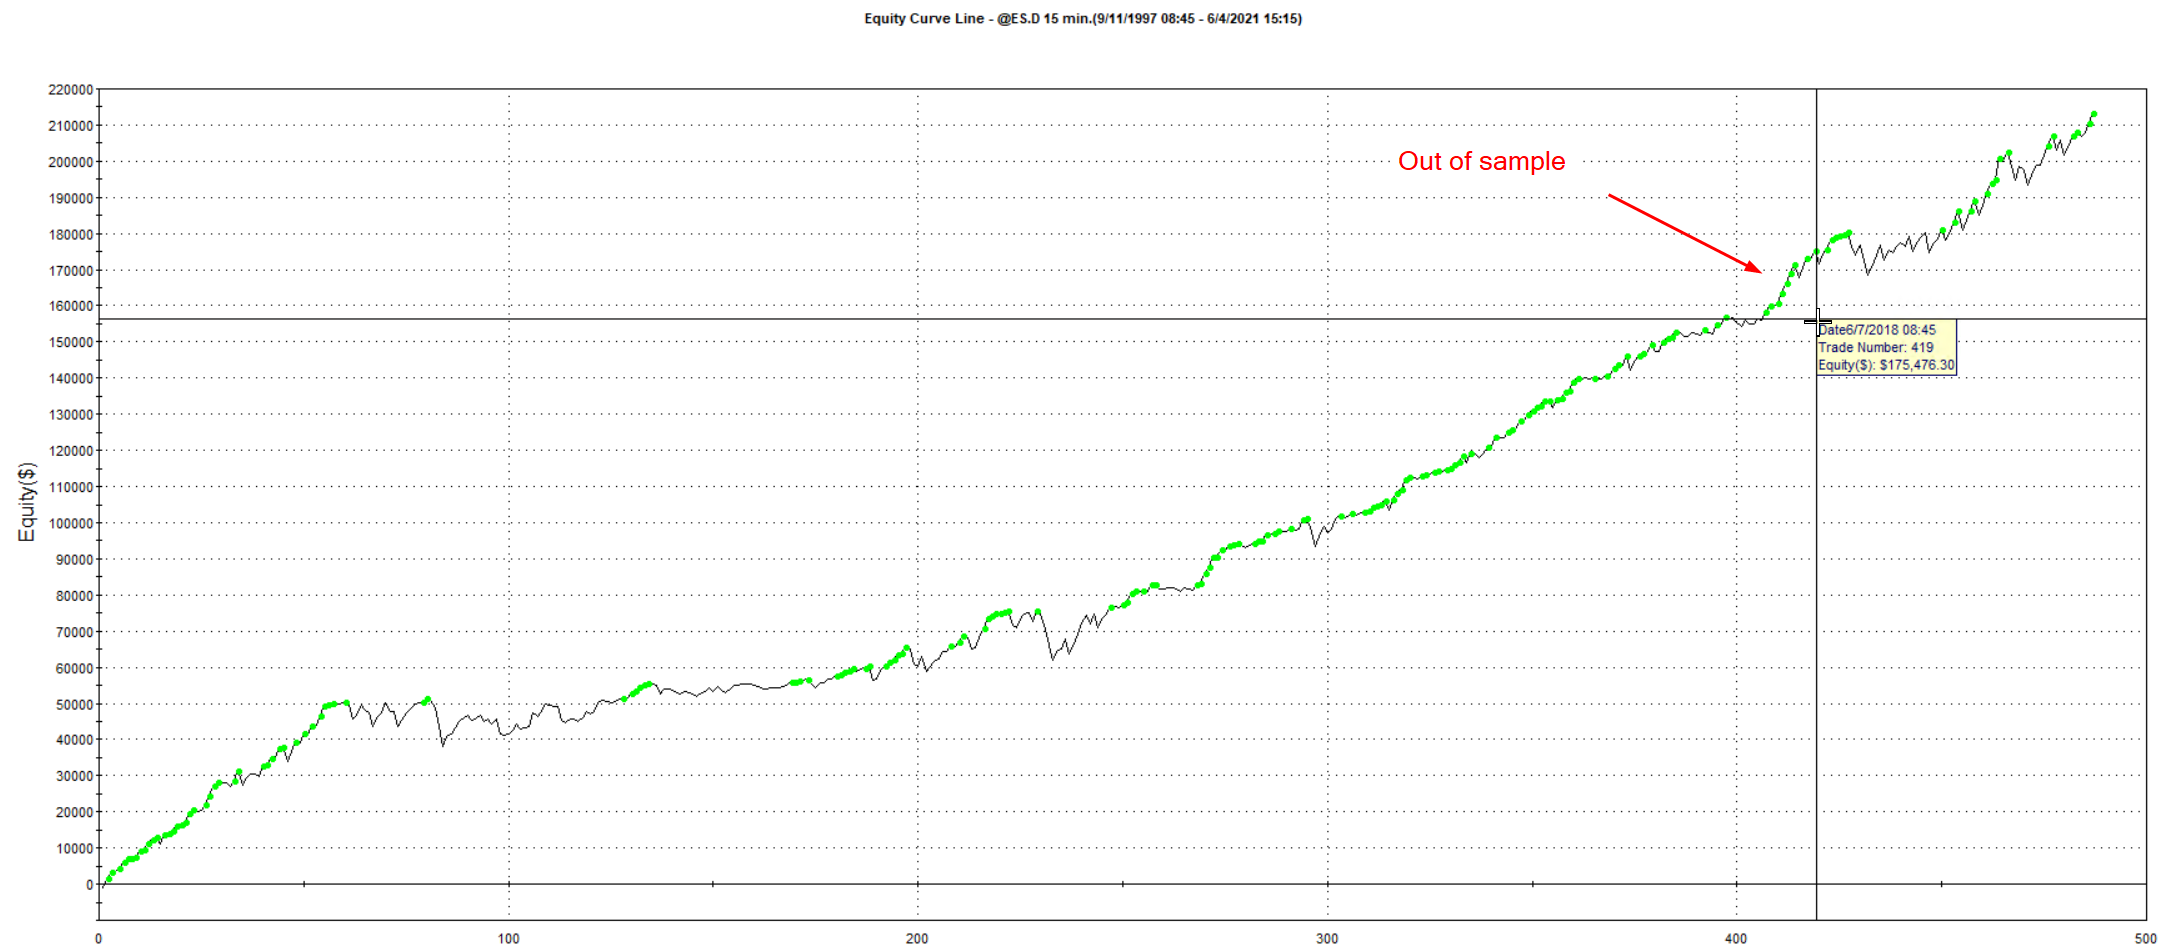
Multiple WF periods • Robust across conditions
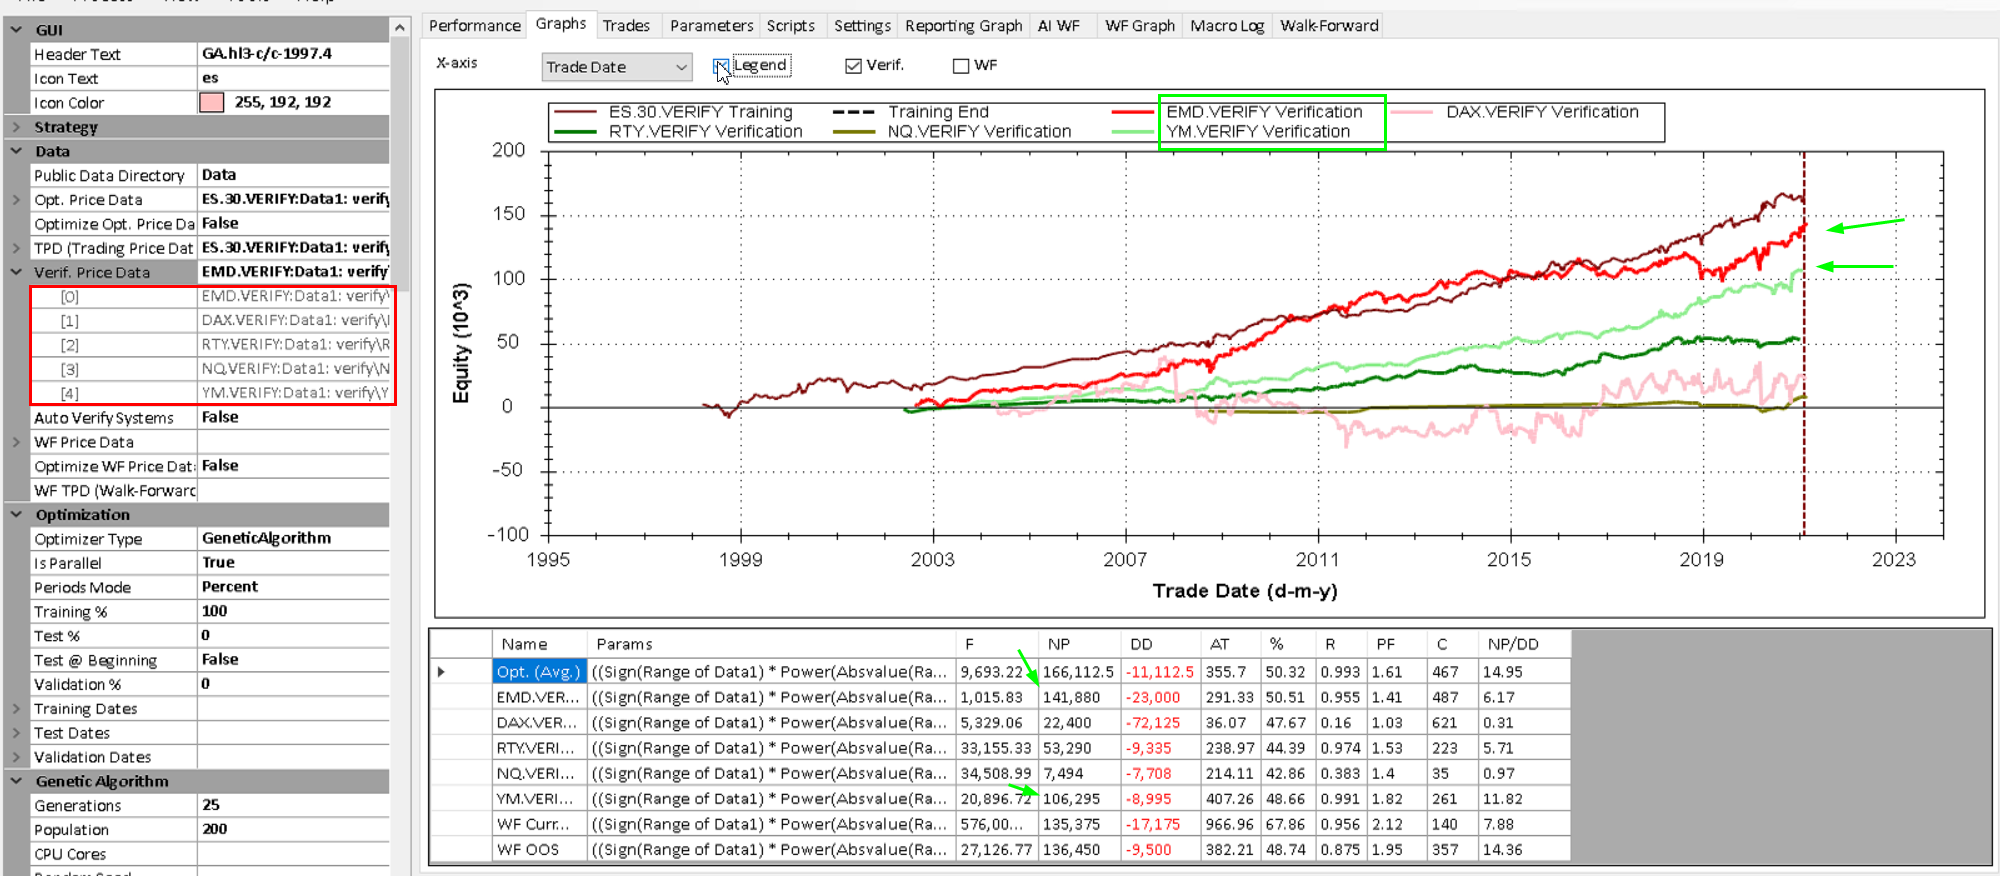
Multiple OOS periods marked • Validated testing
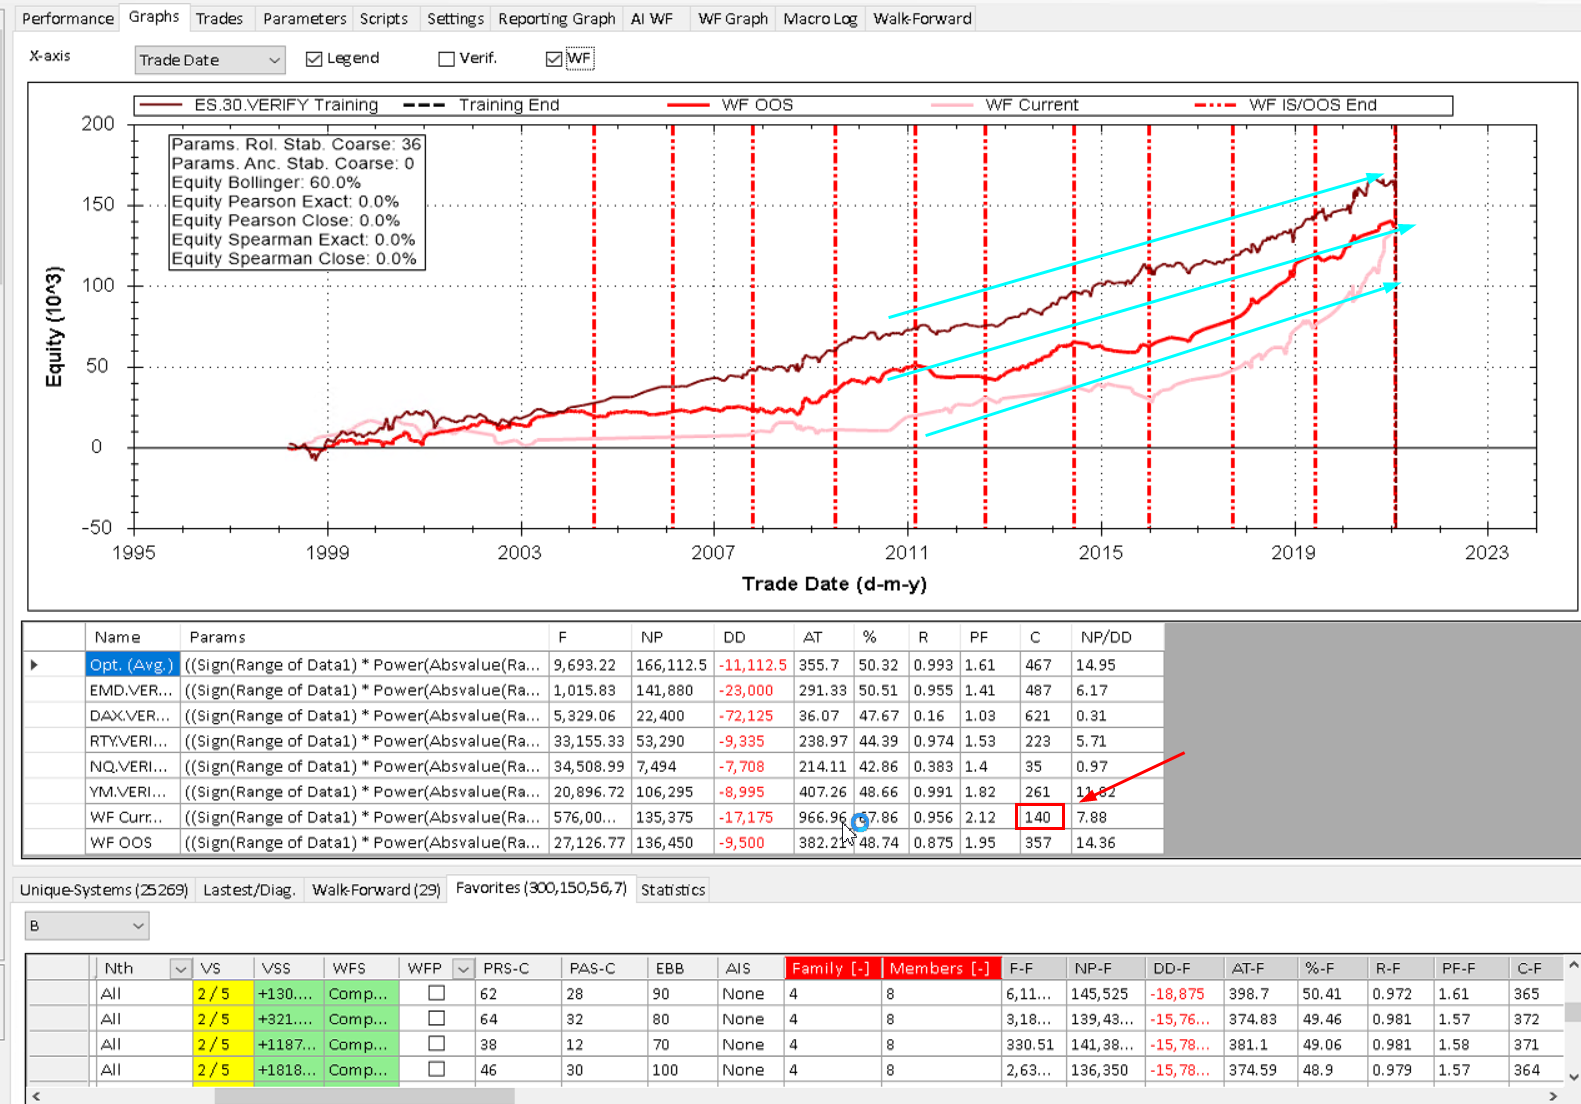
Enhanced walk-forward • Detailed performance metrics
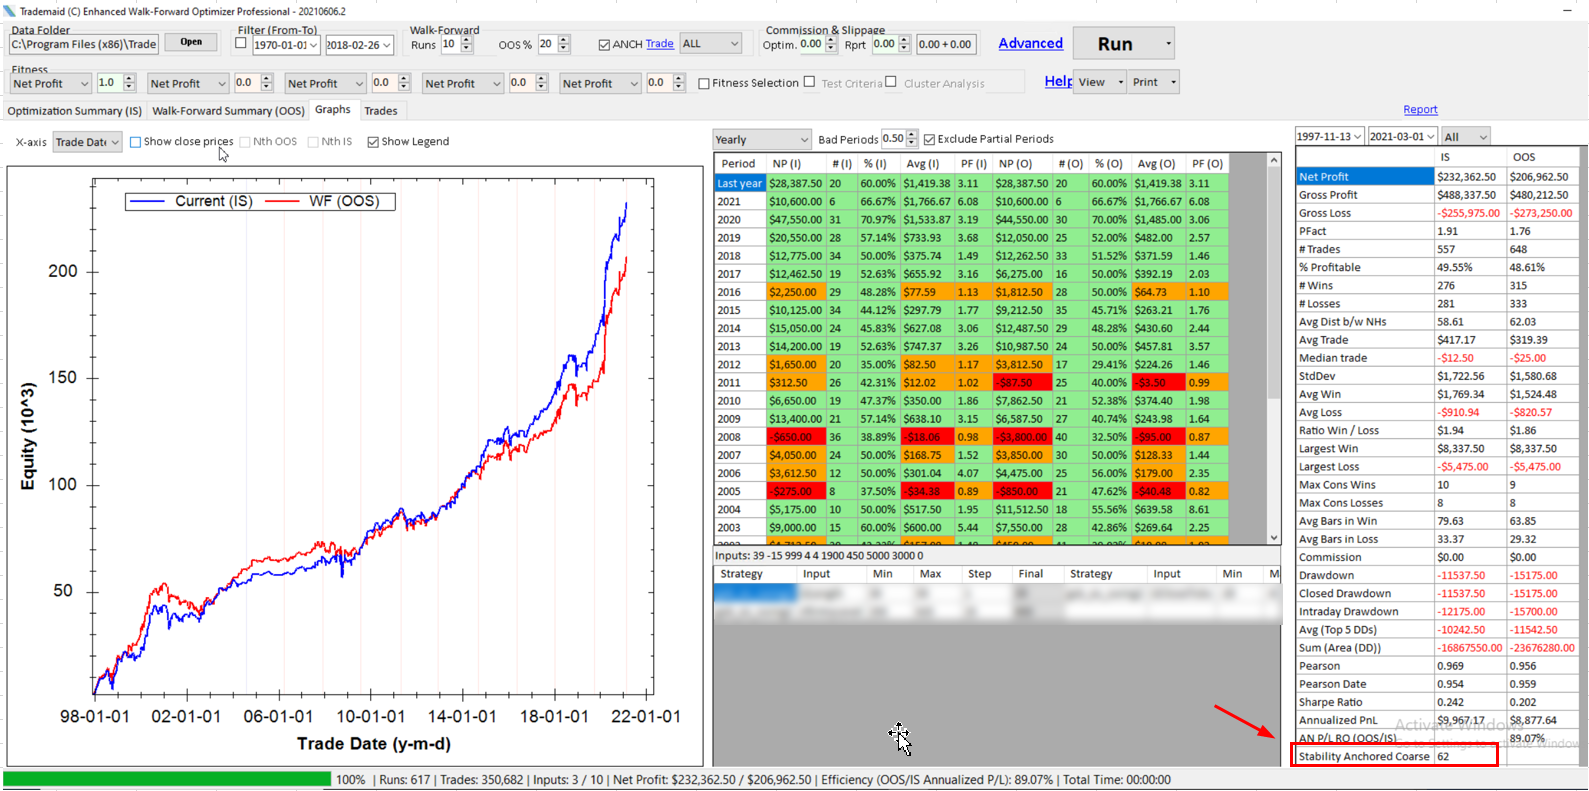
Growth measured by trades • Consistent profitability
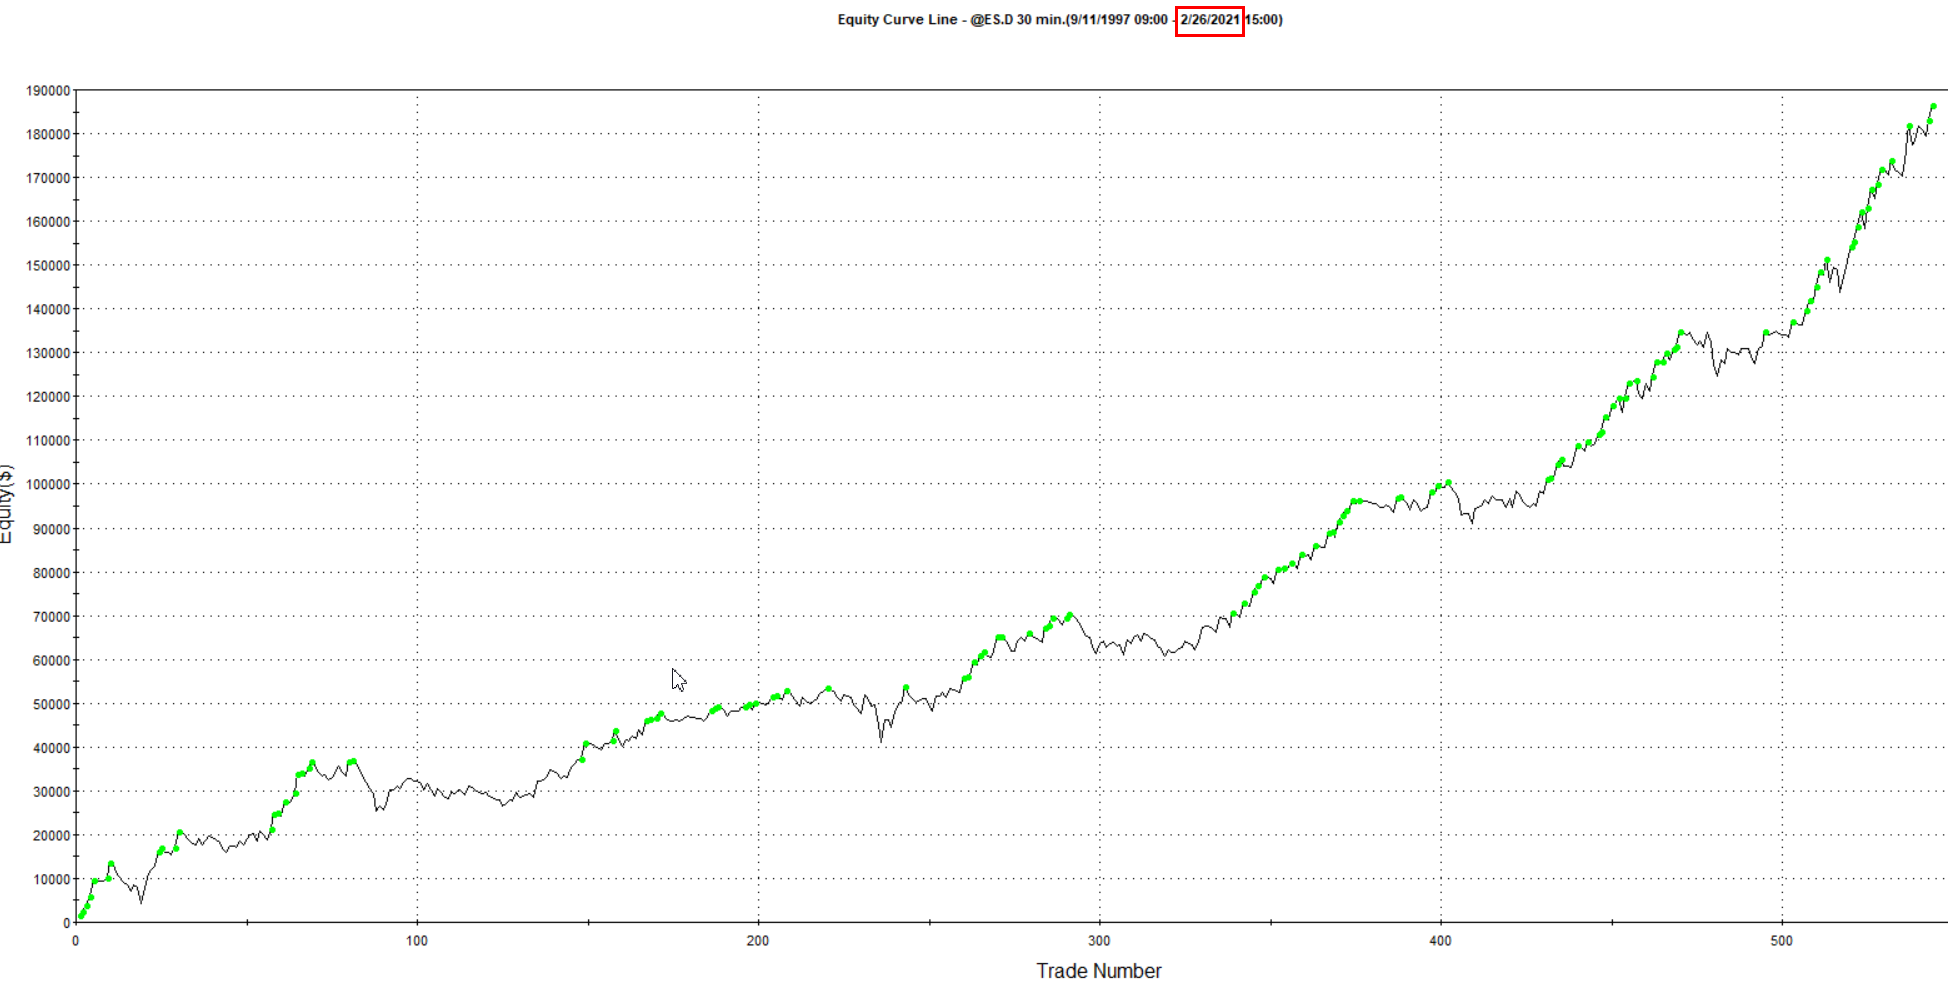
Out-of-sample performance after marker • Verified edge
Current and OOS periods • Blue/Red validation lines
Directional bias strategy • Validated OOS