
EWFO Documentation
Complete guide to Enhanced Walk Forward Optimizer for advanced walk-forward testing and analysis.
Introduction & Concepts
GSB Pro already includes built-in walk-forward optimization. EWFO is a separate, advanced tool for users who need deeper analysis features like cluster analysis, Monte Carlo walk-forward, or who work directly with TradeStation/MultiCharts optimization files.
What is Walk-Forward Optimization?
Walk-forward optimization is a rigorous validation technique that tests whether your strategy's parameter choices remain stable over time. Instead of optimizing over the entire dataset at once (which can lead to curve-fitting), walk-forward divides your data into sequential in-sample (optimization) and out-of-sample (validation) periods.
The process works like this:
- Optimize your strategy over an in-sample period to find the best parameters
- Test those parameters on the following out-of-sample period
- Roll forward and repeat across multiple windows of time
- Combine all out-of-sample results to see true forward-tested performance
Why Use EWFO?
Enhanced Walk Forward Optimizer provides significant advantages over platform-native walk-forward tools:
- 4x Faster Processing – Complete analysis in a fraction of the time
- No File Size Limits – Process files larger than 3GB (limited only by RAM)
- 20+ Fitness Functions – Far more metrics than platform defaults
- Cluster Analysis – Find robust parameter zones, not just single points
- Monte Carlo Walk-Forward – Statistical validation of results
- Batch Processing – Automate multiple walk-forward tests
- Cost Reconfiguration – Change slippage/commission without re-optimizing
The Walk-Forward Process Overview
Using EWFO involves these steps:
- Install EWFO on your Windows machine
- Run an optimization process in TradeStation or MultiCharts (creating WFO files)
- Open those files in EWFO and configure your walk-forward parameters
- Run the walk-forward analysis and review the results
A comprehensive 16-minute introduction video is available: Watch on YouTube
Installation & Setup
System Requirements
- Operating System: Windows 7/8/10/11 (64-bit recommended for large files)
- Platforms: TradeStation or MultiCharts optimization files
- Memory: 8GB+ RAM recommended for large optimization files
- .NET Framework: May require .NET Framework 4.5 or later
Installation Steps
- Download the installer from the Members Downloads area or trial link
- Run the installation file (you may need to temporarily disable antivirus software)
- Create a desktop shortcut to
WalkForwardOptimizer.exefor easy access - If EWFO won't open, ensure you have .NET Framework installed:Download .NET Framework 4.5
Preparation for Usage
Before you can use EWFO, you need optimization files from TradeStation or MultiCharts:
- TradeStation files are located in:
C:\Program Files (x86)\TradeStation 9.5\WFO\Data - MultiCharts files are located in:
C:\ewfo\data\
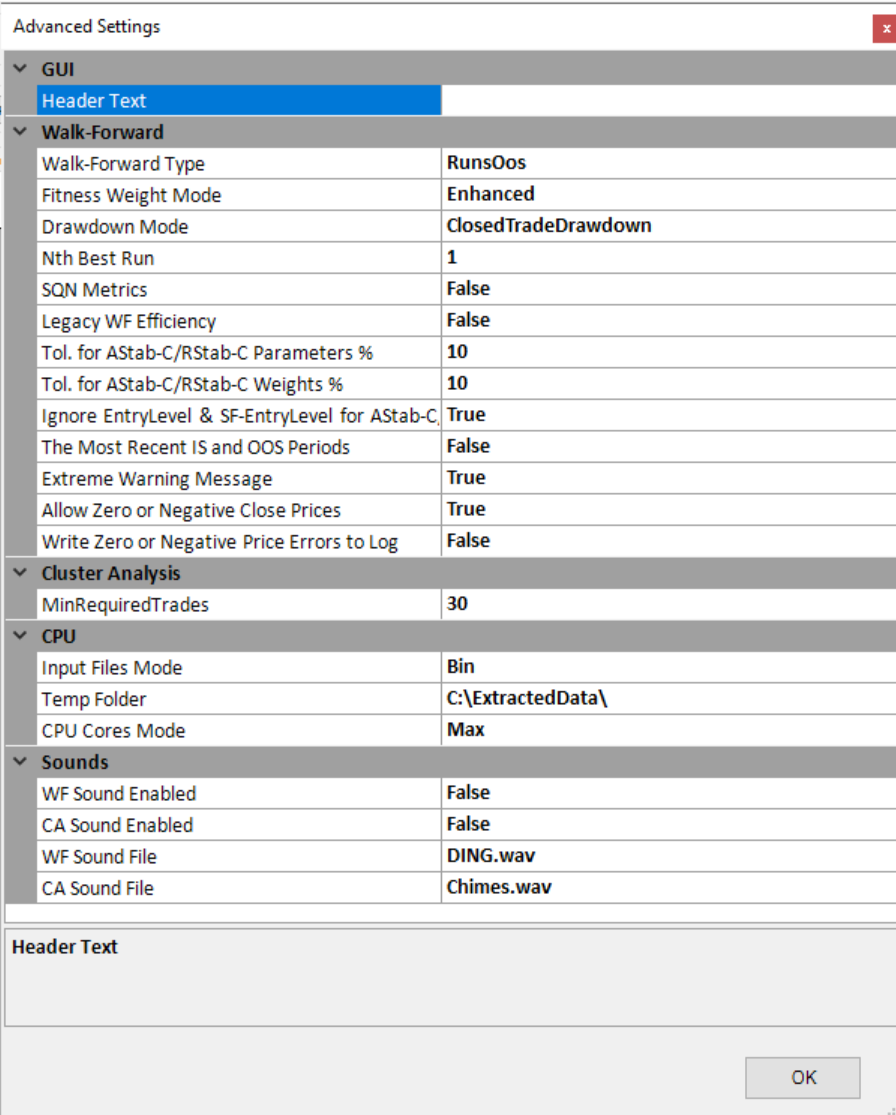
EWFO points to MultiCharts by default. You can change this in the settings to point to your TradeStation folder.

EWFO's control panel where you configure data folders, filters, and walk-forward parameters
Running Walk-Forward Tests
TradeStation Walk-Forward
To create optimization files in TradeStation:
- Open the Strategy Optimization window in TradeStation
- Configure your optimization parameters and ranges
- Run the optimization to generate WFO files
- Find the files in
C:\Program Files (x86)\TradeStation 9.5\WFO\Data
MultiCharts Walk-Forward
To create optimization files in MultiCharts:
- Open the Optimization Report window
- Configure your strategy optimization settings
- Run the optimization to generate MSA files
- Find the files in
C:\ewfo\data\
EWFO Control Parameters
The main control fields in EWFO:
- Data Folder: The optimization test directory from TradeStation or MultiCharts
- Filter (From-To): Limit the date range of data used in analysis
- Walk-Forward Runs: Number of walk-forward periods (e.g., 10 runs = 10 sequential tests)
- OOS Percentage: Portion of each period used for out-of-sample testing (typically 20%)
Commission Settings
EWFO has two commission fields:
- Left commission field: Used in walk-forward calculations only (influences parameter selection but not reported figures)
- Right commission field: Used in both calculations AND reported performance figures
This allows you to test different cost assumptions without re-optimizing in your trading platform.
Nth-Best Parameter Testing
Instead of using the single best parameter combination, EWFO can test the 2nd, 3rd, or Nth best parameters. This stress tests your strategy's sensitivity to parameter choices. Robust strategies should perform similarly even when not using the absolute optimal parameters.
Screen Overview
EWFO's main dashboard with file loading, configuration, and results visualization
Main Interface Areas
The EWFO interface is divided into several key areas:
- File Loading Area: Open and navigate to optimization files from TradeStation or MultiCharts
- Control Panel: Configure walk-forward parameters, runs, date filters, and commission settings
- Fitness Selection: Choose and weight fitness functions for parameter selection
- Results Area: View optimization summaries, walk-forward summaries, graphs, and statistics
- Test Criteria: Configure robustness thresholds for cluster analysis
Opening Optimization Files
- Click the Open button in EWFO
- Navigate to your TradeStation WFO folder or MultiCharts data folder
- Select the optimization test folder and click "Select Folder"
- EWFO will load the optimization data and display available parameters
Reading the Results
Reporting Area
After running a walk-forward test, EWFO displays comprehensive results in several tabs:
Folder Optimization Summary (In-Sample)
Shows the results of parameter optimization during each in-sample period. This is what your strategy "learned" during the optimization windows.
Folder Walk-Forward Summary (Out-of-Sample)
Shows how the optimized parameters performed during the out-of-sample (forward testing) periods. This is the true measure of strategy robustness.
Graphs & Visualizations
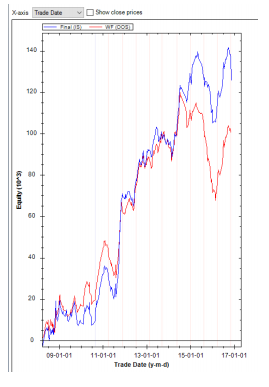
Equity Curves
Compare in-sample optimization results with out-of-sample walk-forward performance on the same chart. A robust strategy shows similar curve shapes in both periods.
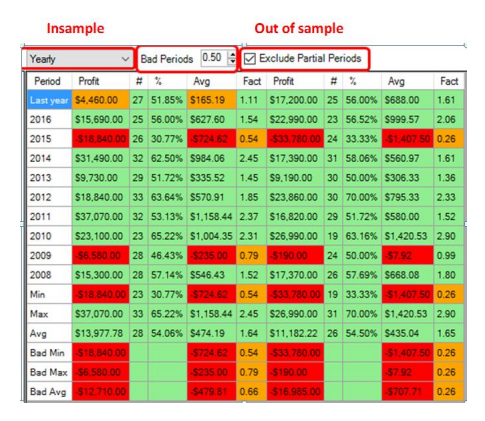
Performance Matrix
Visualize parameter performance across all walk-forward windows. Identify which parameter combinations maintain consistency throughout the test period.
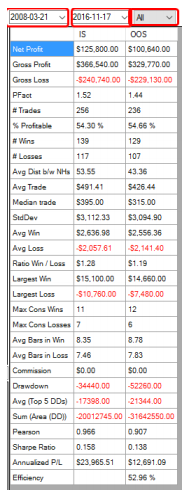
Comprehensive statistics for each walk-forward window including net profit, drawdown, profit factor, and trade counts
Key Metrics to Watch
- Walk-Forward Efficiency: Ratio of out-of-sample to in-sample annualized returns. Values above 60% indicate robustness.
- Parameter Stability: How much parameters change between walk-forward windows. Less variation is better.
- IS/OOS Ratio: Ratio of in-sample to out-of-sample net profit. Values between 0.7 and 1.3 are acceptable.
- Equity Match Degree: How closely the out-of-sample equity curve matches the in-sample curve shape.
Fitness & Methodologies
Fitness Types
EWFO offers 20+ fitness functions that determine how the "best" parameter combination is selected. Popular options include:
- Net Profit: Total profit from all trades
- Net Profit × Average Trade: Balances total profit with per-trade profitability
- NP/DD × Average Trade: Net profit to drawdown ratio with trade quality
- NP / Avg 5 Worst Drawdowns: Focuses on recovery from the worst losses
- Profit Factor: Ratio of gross profit to gross loss
- Sharpe Ratio: Risk-adjusted return measurement
- Pearson's Correlation (R): How closely the equity curve matches a straight line
- Volatility-Based Fitness: Adjusts fitness based on market volatility
- SQN (System Quality Number): Van Tharp's metric for trading system quality
Fitness Weighting
You can combine multiple fitness functions with custom weights. For example:
Net Profit (1.0), Average Trade (0.5)– Prioritizes profit but considers trade qualityNP/DD (1.0), Sharpe Ratio (1.0)– Balances return-to-risk metrics
Fitness Selection Best Practices
Important: It's possible to curve-fit your fitness selection just like parameters. To avoid this, remove the last 3 years of data before running fitness stability scores. Once you've selected a fitness function, include all data for your final walk-forward test.
System Quality Number (SQN)
SQN was developed by Van Tharp to measure how "stable" a trading system's trade statistics are. Higher SQN values indicate lower probability that results are due to random luck.
EWFO implements an advanced SQN methodology that:
- Calculates SQN across three time segments (full, 67%, 33% of data)
- Uses the minimum value ("weakest link") for robustness
- Combines with NP/DD to create a "Rank" metric
Note: SQN is computationally expensive and can increase walk-forward time by 3x.
Walk-Forward Efficiency
Walk-forward efficiency measures how well in-sample optimization translates to out-of-sample performance. It's calculated as:
Efficiency = (OOS Annualized Return) / (IS Annualized Return) × 100
Values above 60% are generally considered acceptable. This metric is a key indicator of strategy robustness.
Advanced Analysis Tools
Cluster Analysis
Cluster analysis is one of EWFO's most powerful features. Instead of relying on a single "best" parameter set, it identifies groups of similar parameters that all perform well together.
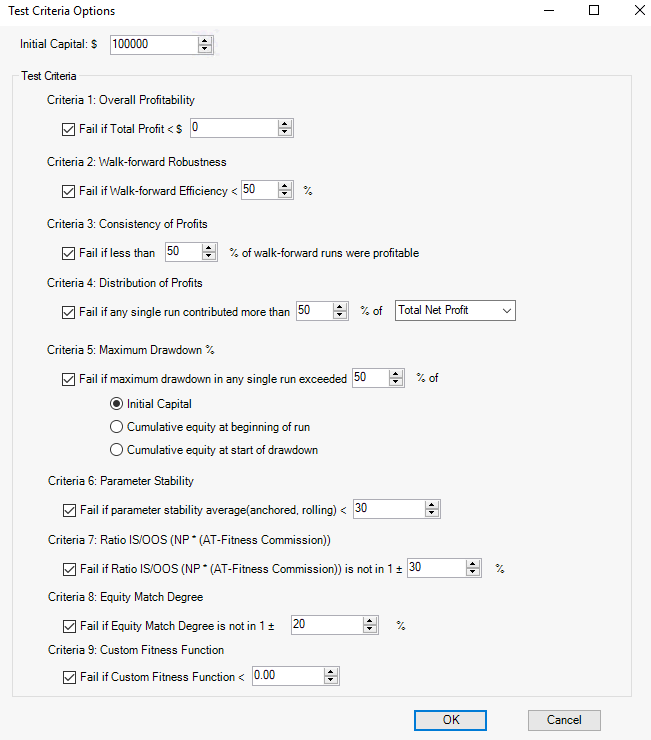
Configure cluster analysis test criteria and thresholds
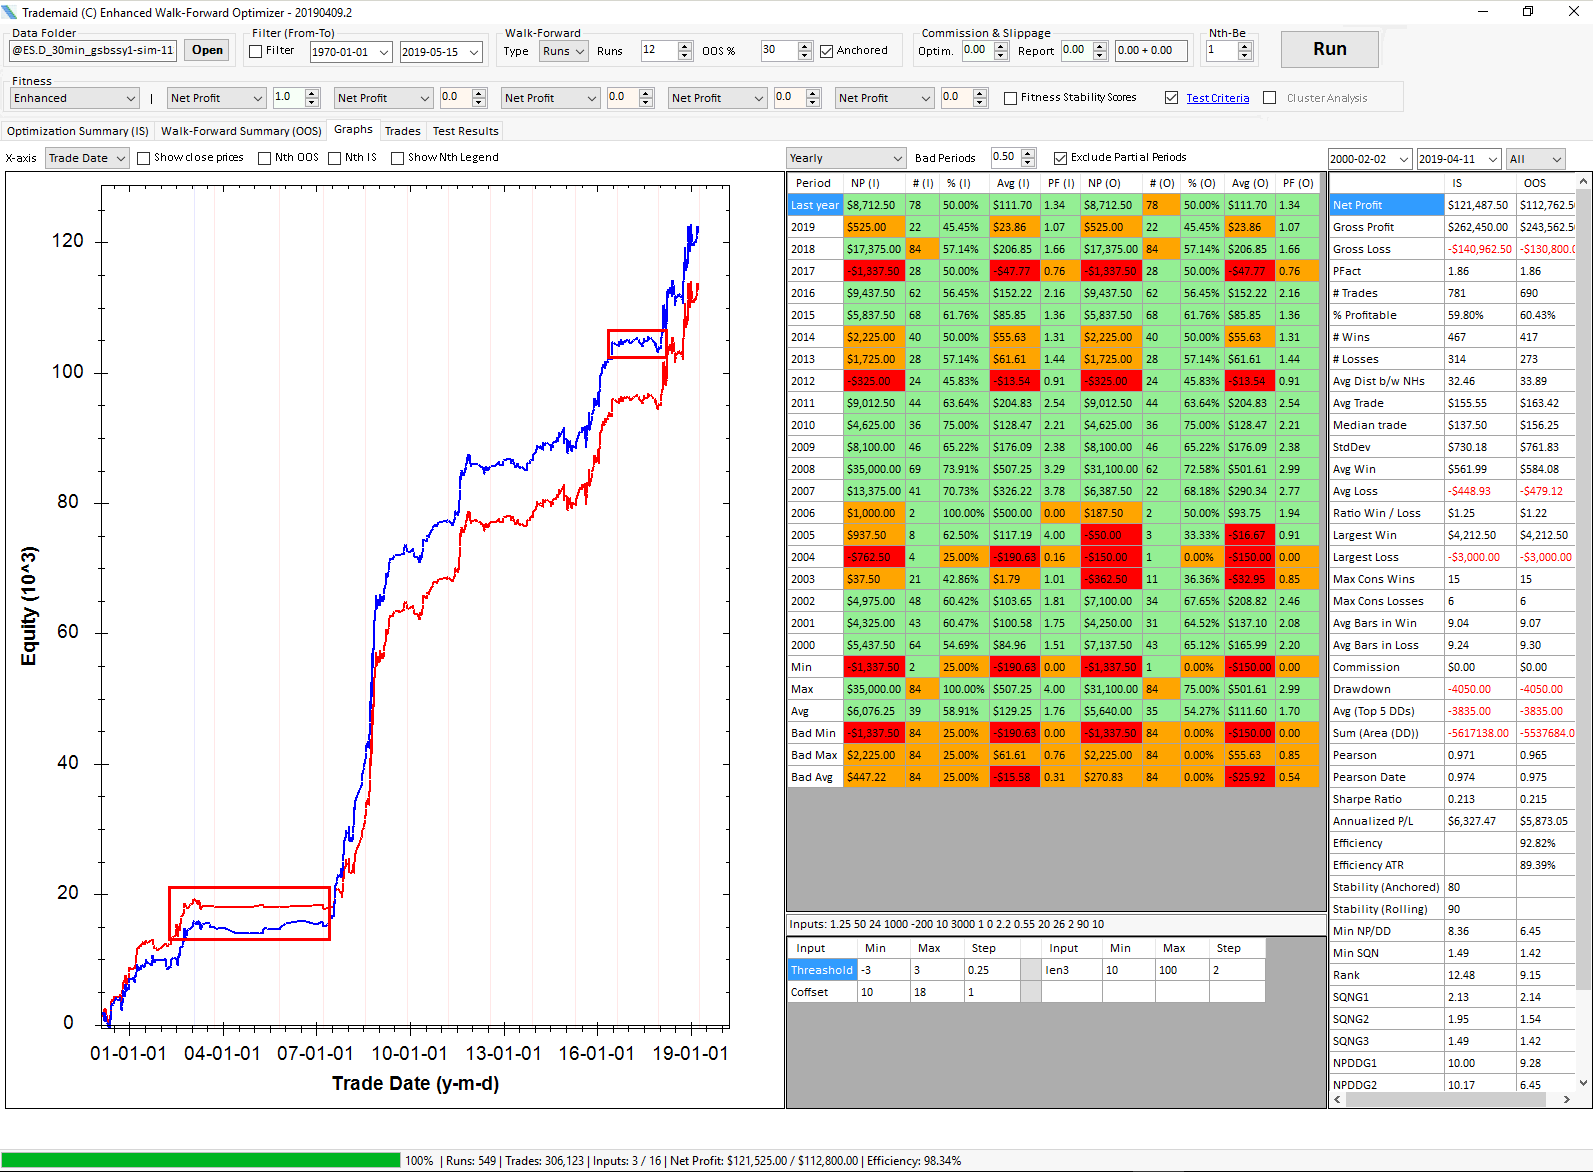
View cluster results showing robust parameter zones
Cluster Analysis Guidelines
- No single walk-forward run should contribute more than 50% of total profit
- No single run should contribute more than 25% of total losses
- At least 8 out of 10 runs should be profitable
- Walk-forward efficiency should be above 60%
- OOS trades should be at least 80% of IS trades (in number and average size)
- Look for a minimum of 8 successful cells near the center of the parameter matrix
Parameter Stability Metrics
- Anchored Parameter Stability: Measures how close final parameters are to all previous parameter selections
- Rolling Parameter Stability: Measures how close each parameter set is to the previous one
Monte Carlo Walk-Forward
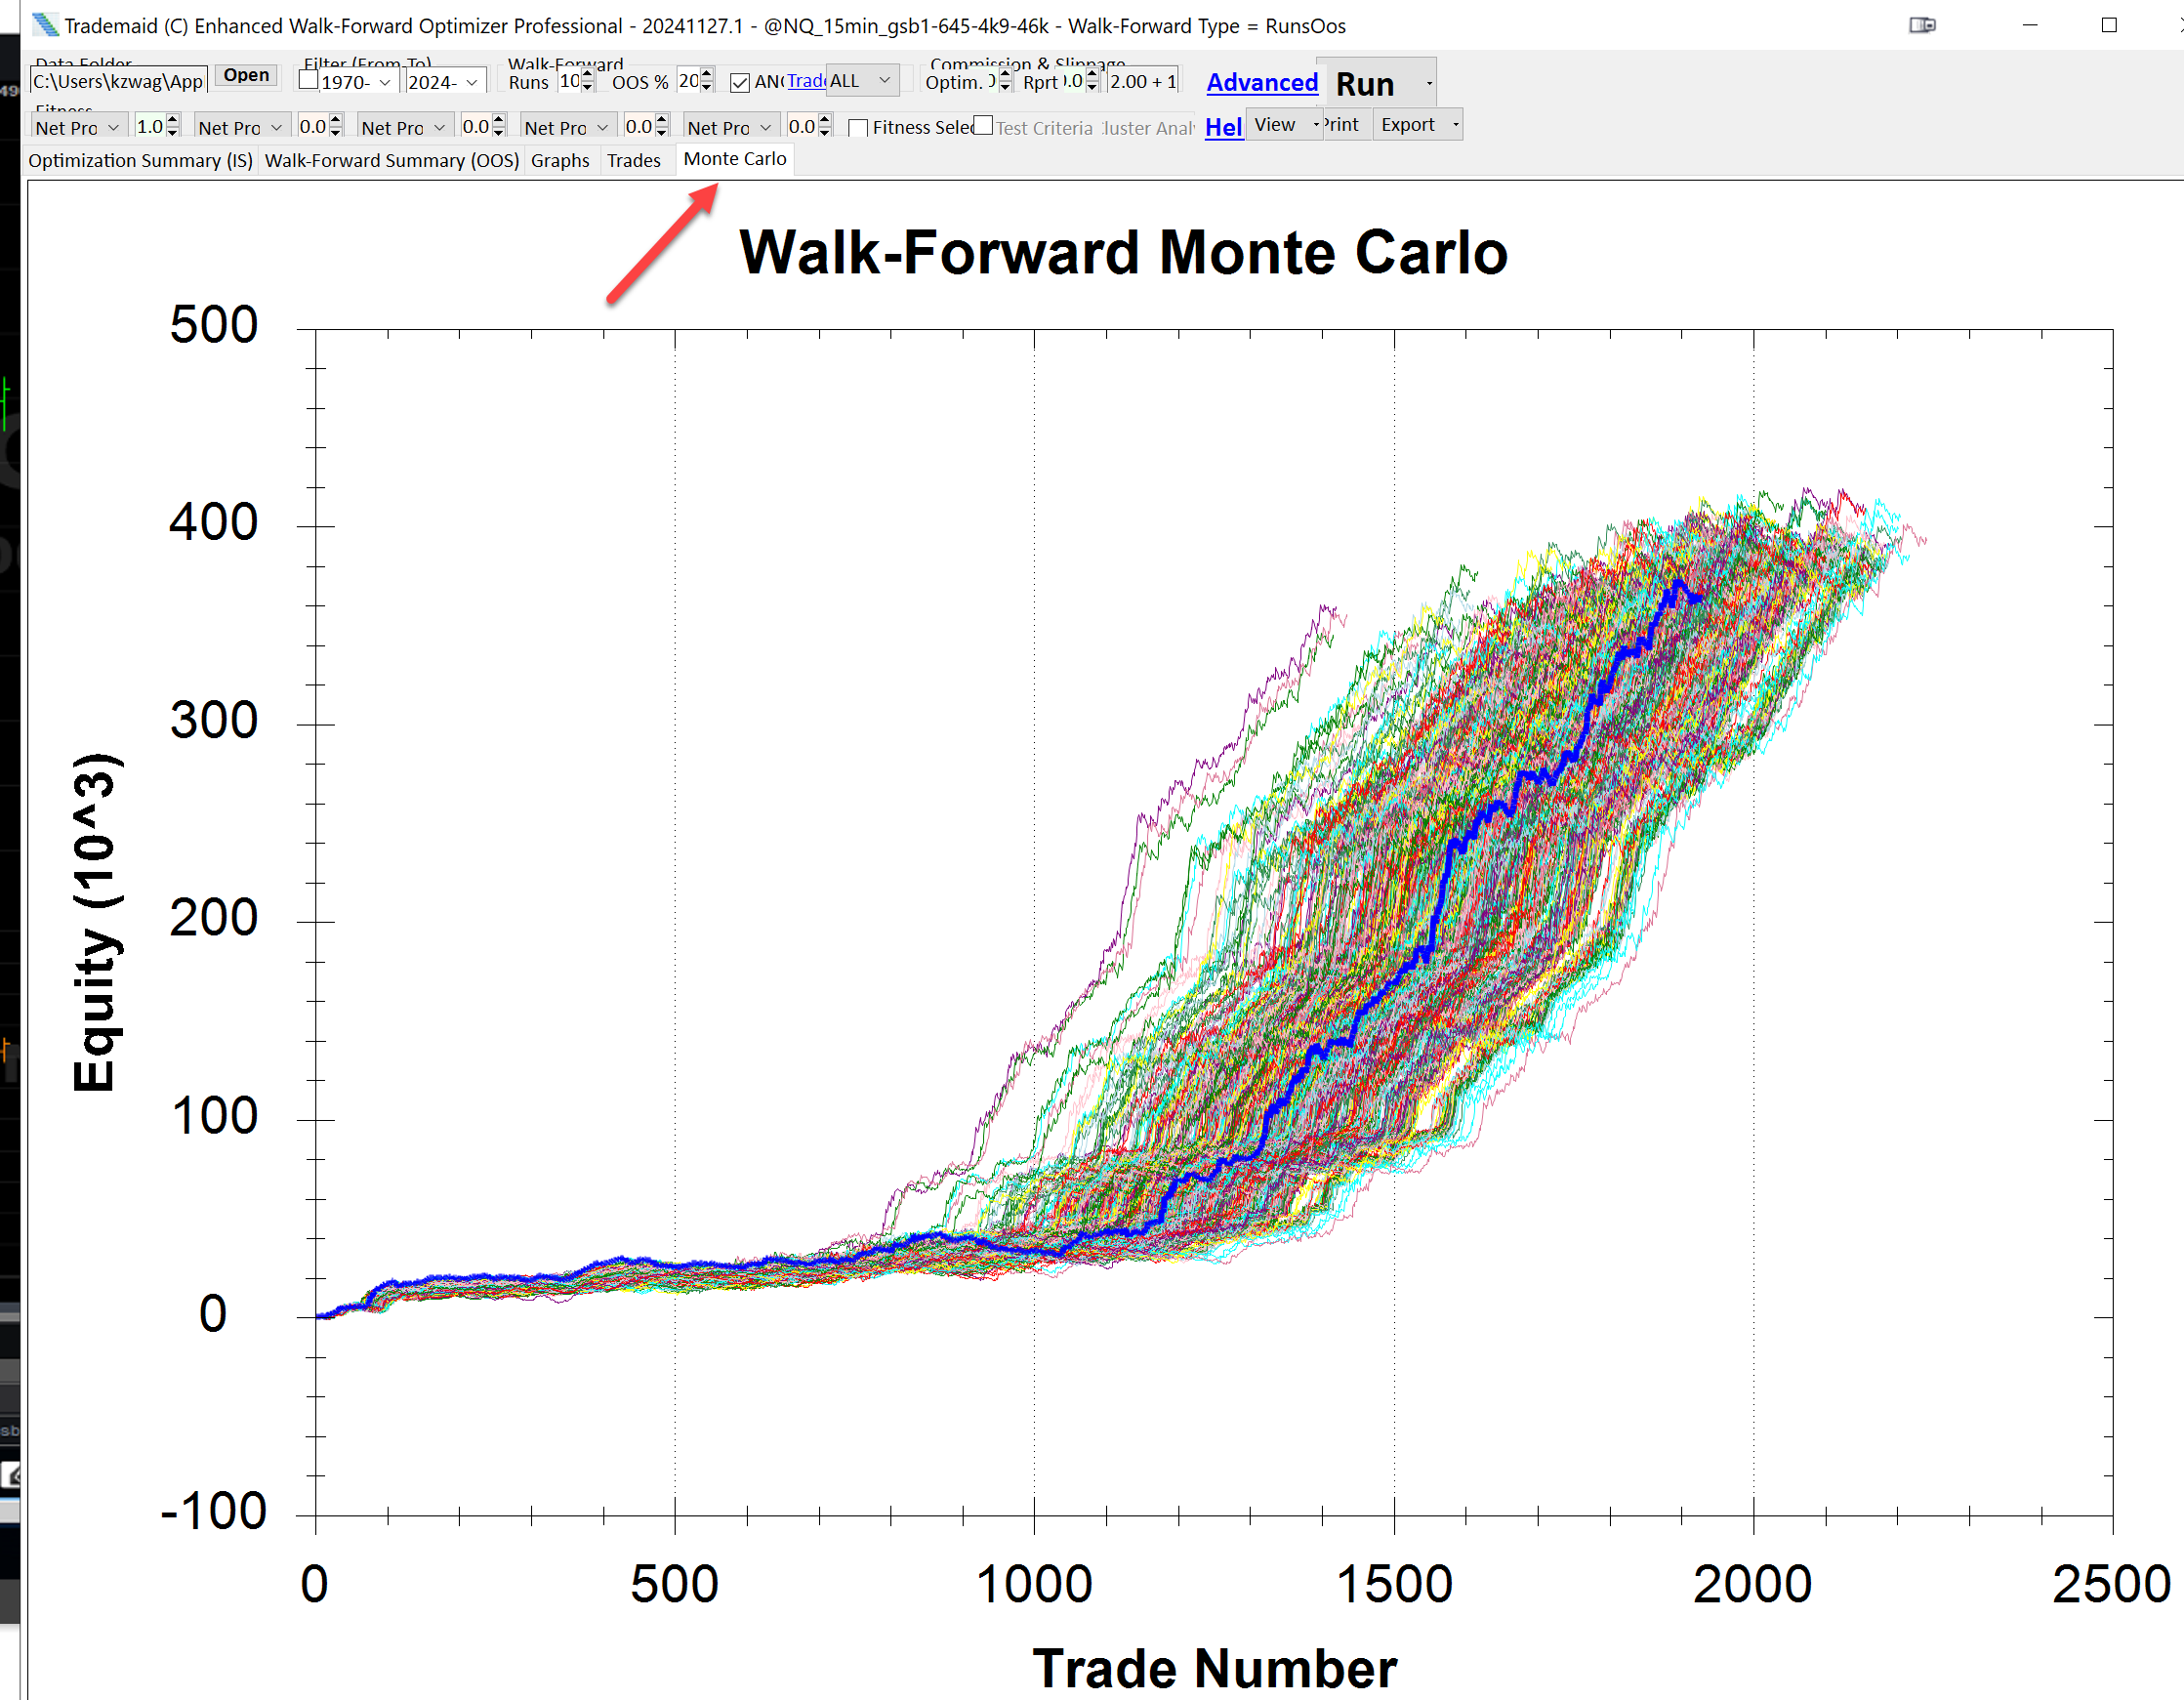
Monte Carlo walk-forward showing multiple simulated equity curves compared to the actual result
Monte Carlo walk-forward tests all combinations of walk-forward runs and displays them graphically. This helps validate whether your results are statistically significant or potentially due to luck.
Interpretation:
- Good result: Most simulated curves are above the final equity curve (shown as thick blue line)
- Poor result: Many simulated curves fall below the final equity curve
Long/Short Walk-Forward
EWFO can perform separate walk-forward analysis for long and short trades, allowing you to evaluate whether your strategy works equally well in both directions or if it's biased toward one side.
Nth Best Parameter Testing
Instead of using the optimal parameter set, test with the 2nd, 3rd, or Nth best parameters. This stress tests your strategy's robustness—if results deteriorate significantly when using sub-optimal parameters, the strategy may be over-fitted.
Batch Mode & Automation
Batch Processing
EWFO supports batch processing of multiple walk-forward files. This allows you to automate the analysis of many strategies or parameter sets.
- Configure your walk-forward settings as desired
- Save the parameters using the "Save Parameters" option
- Select "Run in Batch Mode"
- Choose your saved parameter file
- Select an output folder for results
- Click "Run" to process all files
Multiple Parameter Files
You can test multiple parameter configurations across the same optimization data. This is useful for comparing different fitness function choices or walk-forward settings.
Command Line Options
EWFO supports command-line execution for full automation:
ewfo.exe -p <parameter file> -d <data folder> -o <output folder>
ewfo.exe -p <parameter file> -f <data folder file> -o <output folder>

Options:
  -p, --parameter : Parameter file path
  -d, --data      : Data folder (can be used multiple times)
  -f, --datafile  : Specify data folders from a file
  -o, --output    : Output folder path
  -e, --autoexit  : Exit automatically when done
  -s, --silent    : Don't open output folder when done
  -h, --help      : Show help message
Troubleshooting
If EWFO fails to launch, you may need to install .NET Framework 4.5:
Download .NET Framework 4.5For very large optimization files (10GB+):
- Use a 64-bit Windows installation
- Ensure you have sufficient RAM (16GB+ recommended)
- Close other applications to free up memory
- Consider reducing optimization parameter ranges or step sizes
- Add an exception for the EWFO installer and installation folder
- Temporarily disable your antivirus during installation
- Restore any quarantined files from your antivirus vault
See the Downloads page for detailed instructions on handling antivirus warnings.