
Building Nasdaq 23-Hour Swing Systems: Long-Only with Linear Equity Curves
Discover how extending trading hours to 23 hours per day, 5.5 days per week produces surprisingly linear equity curves for long-only Nasdaq systems while reducing overnight risk exposure.
Scenario
Most day traders limit their systems to regular market hours (8:30 AM to 3:00 PM), missing significant price action during extended trading sessions. This approach explores a different paradigm: swing systems that operate 23 hours daily (Sunday 5 PM to Sunday midnight) to capture multi-day moves while maintaining reduced overnight risk compared to traditional overnight holds. The challenge is that extended-hour data contains 3x more bars than standard sessions, requiring more computing resources and careful optimization to avoid curve-fitting the additional data points.
Approach
Identify which indicators work best for 23-hour NQ:
• First pass: build 2,500 systems with GreenMax10 macro
• Use all available indicators to cast a wide net
• Analyze which indicators appear in top systems
• Select top 10 performing indicators
Second pass:
• Rebuild systems using only your top 10 indicators
• This focused approach prevents indicator overload
• Ensures final systems use proven components only
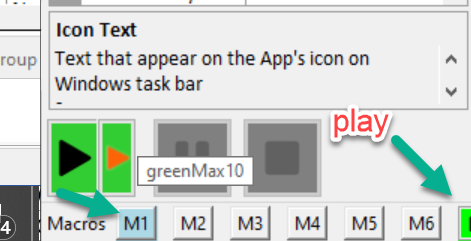
Macro 1 configuration for initial indicator discovery pass
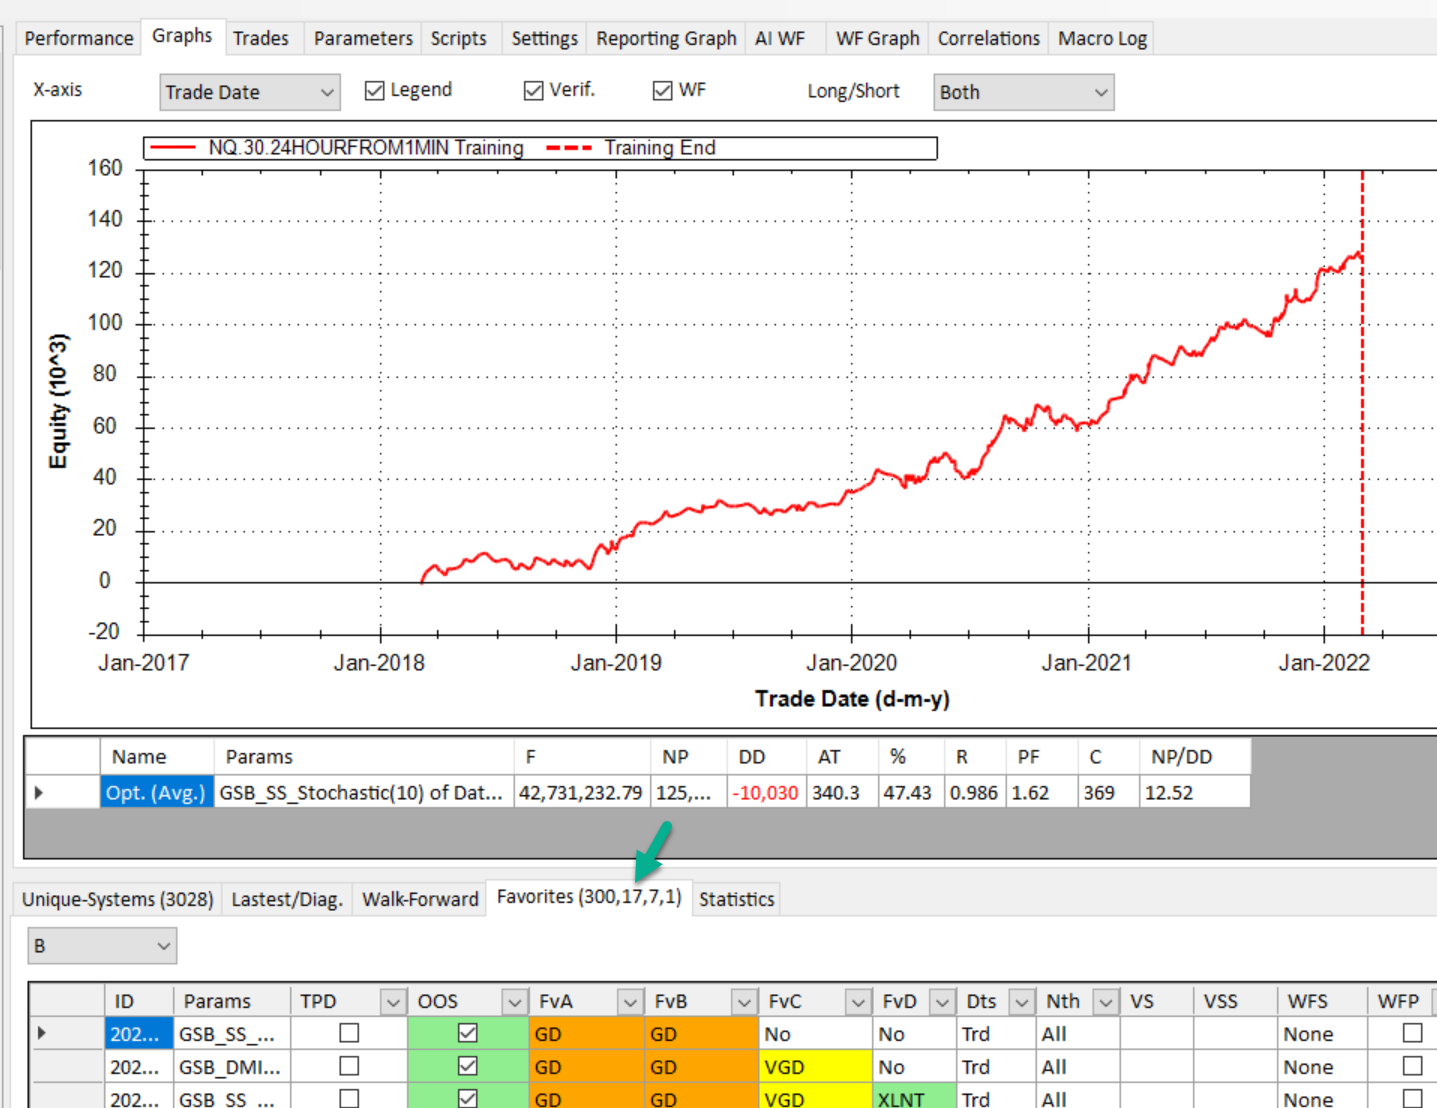
Successful build showing systems distributed across Favorites B, C, and D
Set up parameters specific to 23-hour swing trading:
• Secondary Filter: CloseLessClosedBPV (NOT normalized)
• Entry type: AnyIndicatorStop
• Exit mode: SFR or IFltRvAndSFRv
• Entry time window: 9:00 AM to 3:00 PM only
• Exits allowed: anytime market is open
• Stop loss: $1,250
• Profit target: $2,500
• Nth parameter: 20 (reduces system density)
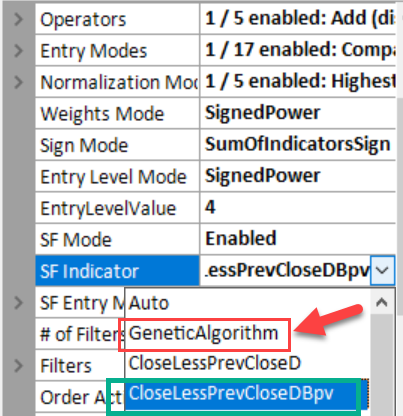
CloseLessClosedBPV not normalized—key configuration difference from standard genetic builds
Choose your best systems carefully:
• Walk-forward top performers to workers
• Reduce to only unique system variations (critical!)
• Examine walk-forward equity curves closely
• Look for: parallel lines between in-sample and out-of-sample
• Good sign: brown (OOS) curve follows in-sample patterns
• Red flag: curves diverging significantly over time
Reject any systems with diverging walk-forward curves.
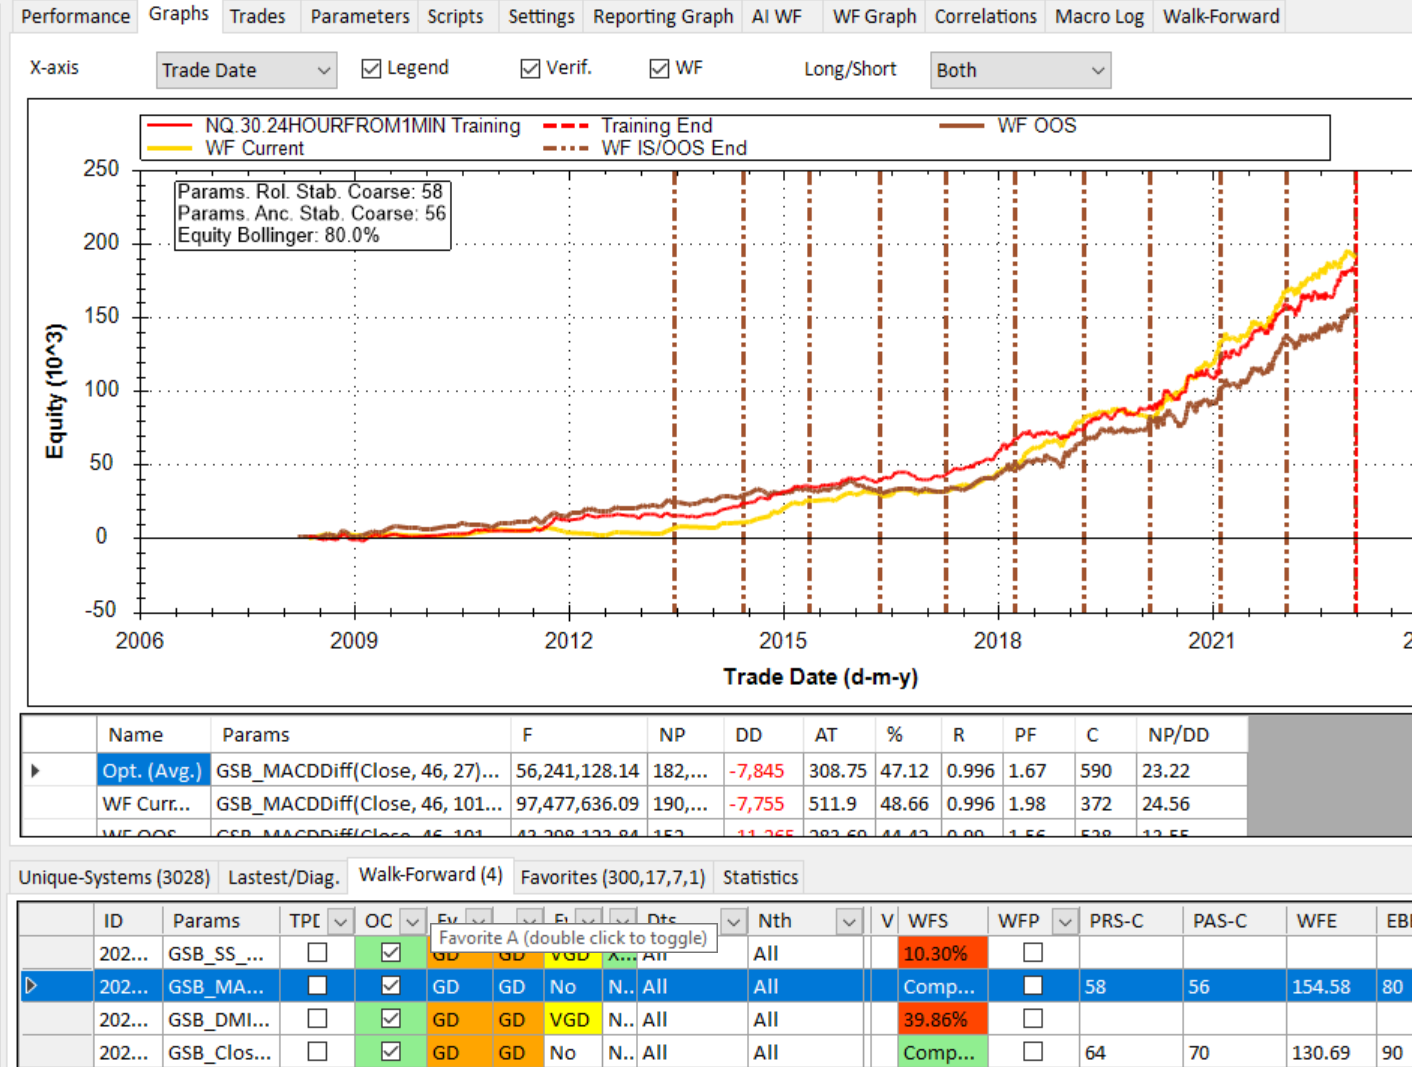
Excellent walk-forward: very parallel curves with strong out-of-sample (brown) performance
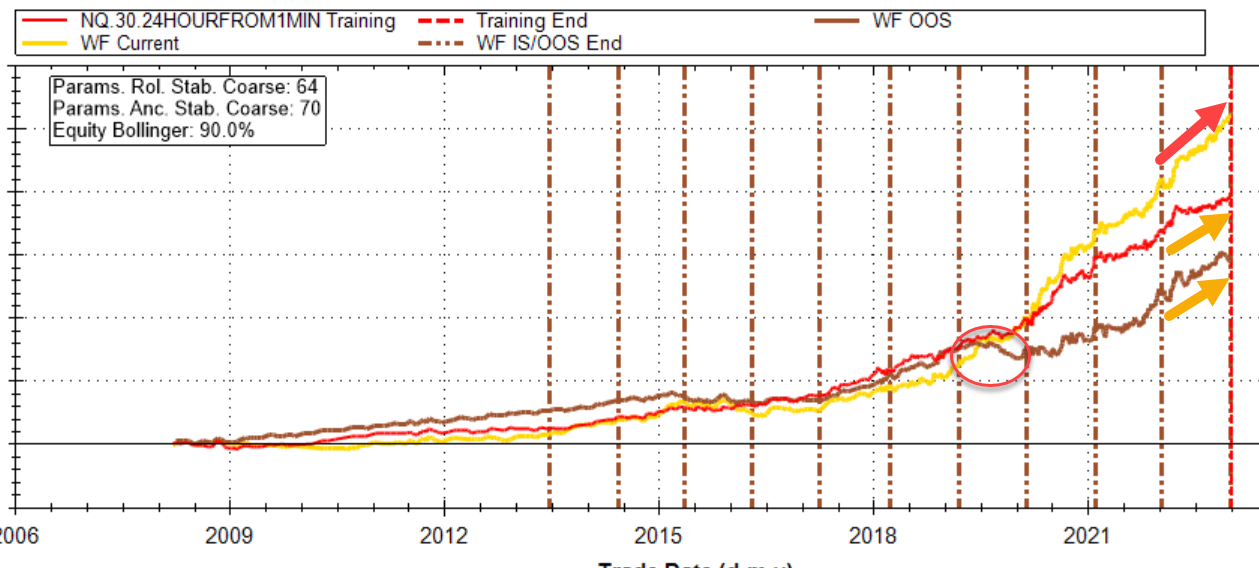
Poor walk-forward: large divergence between curves that grows over time—reject these systems
Verify every indicator pulls its weight:
• For each selected system, test indicators one at a time
• Comment out all other indicators in the code
• Run each indicator on unseen data (after March 1, 2022)
• If any single indicator performs poorly, remove it
This catches indicators that helped during optimization but fail on fresh data.
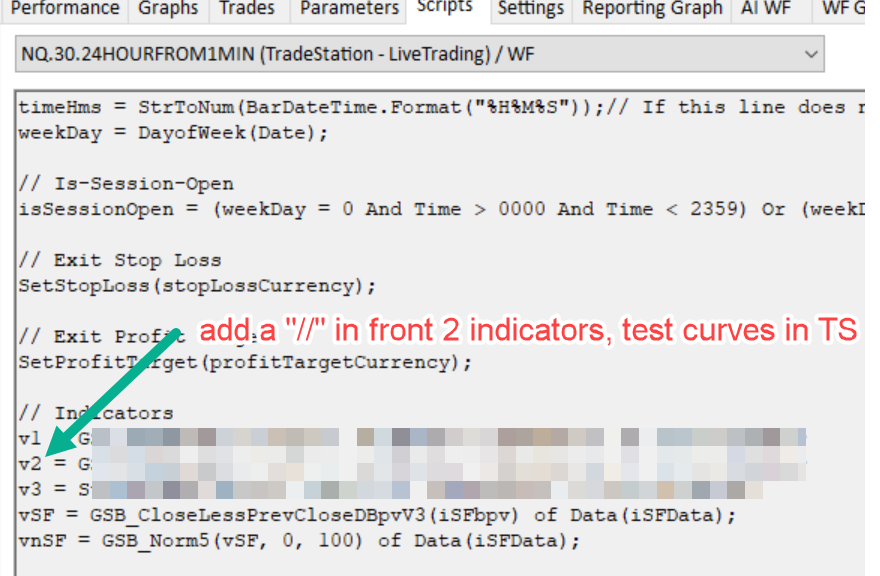
Comment out indicators one at a time to verify each contributes positively on unseen data
Fine-tune for better risk management (optional):
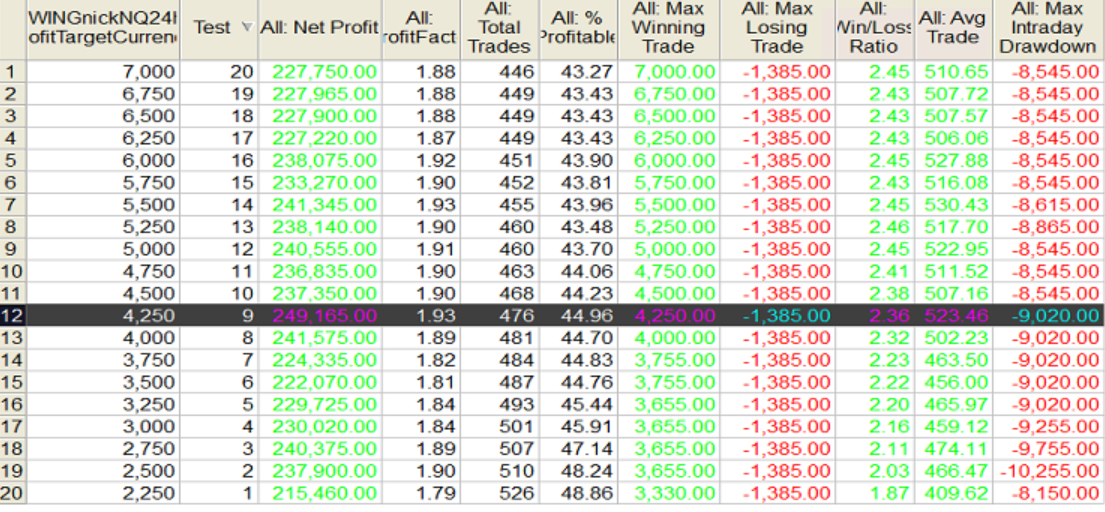
• Add break-even stop: $500-$2,750 range recommended
• Consider optimizing profit target up to $6,000
• Warning: higher profit targets can curve-fit to rare big days
• Conservative default settings avoid this trap
• Only optimize on completely fresh out-of-sample data
These enhancements should improve risk-adjusted returns.

Adding break-even stop to reduce drawdown—change profitTargetCurrency to input for optimization
Performance shown without slippage through October 2023 with one additional non-GSB filter
Results & Insights
Systems built with this methodology show remarkably linear equity curves—a rarity in systematic trading. The 23-hour approach successfully reduces overnight gap risk while capturing extended session volatility. Key finding: these long-only systems work exceptionally well on Nasdaq but produce significantly weaker results when ported to S&P 500, suggesting the extended hours provide unique edge specifically for NQ. The same approach showed mixed results on Russell 2000 and Dow futures. Worker memory requirements are high (approximately 10GB per worker) due to the 3x bar count, making this approach best suited for traders with substantial computing resources or access to cloud workers.
Key Takeaways
Extended trading hours (23hr/day) can produce more linear equity curves than standard sessions
Long-only systems reduce complexity and can be highly effective with proper filtering
The optimal settings (entry times, profit targets, stops) differ significantly from standard day trading systems
Individual indicator validation after selection catches components that fail on unseen data
Market-specific optimization matters—strategies that excel on one index future may fail on others
High memory requirements (10GB+ per worker) make this approach resource-intensive but worthwhile for the right markets
Based on methodology examples from the original GSB/TradeMaid documentation, used with permission.