
Scenario
Index futures (E-mini S&P 500, Nasdaq, and Dow) offer substantial liquidity and tight spreads, making them ideal for algorithmic day trading. However, these markets are highly competitive with many sophisticated participants. The challenge is discovering systems that maintain their edge across different market regimes—not just bull markets or high volatility periods, but consistently profitable across years of varied conditions. This methodology uses multiple out-of-sample periods (2017-2021 split into yearly chunks) to verify systems work across different environments, not just the specific conditions they were optimized on.
Approach
Build 20,000 systems to identify winning indicators:
• Load 75 pre-selected indicators (41 for trial users)
• Run GreenMin10 macro for automatic discovery
• Analyze which indicators appear in top systems
• Select the top 10 most frequent winners
• Results vary each run—this creates strategy diversity
With 20-40 cloud workers, this completes in 90-120 minutes.
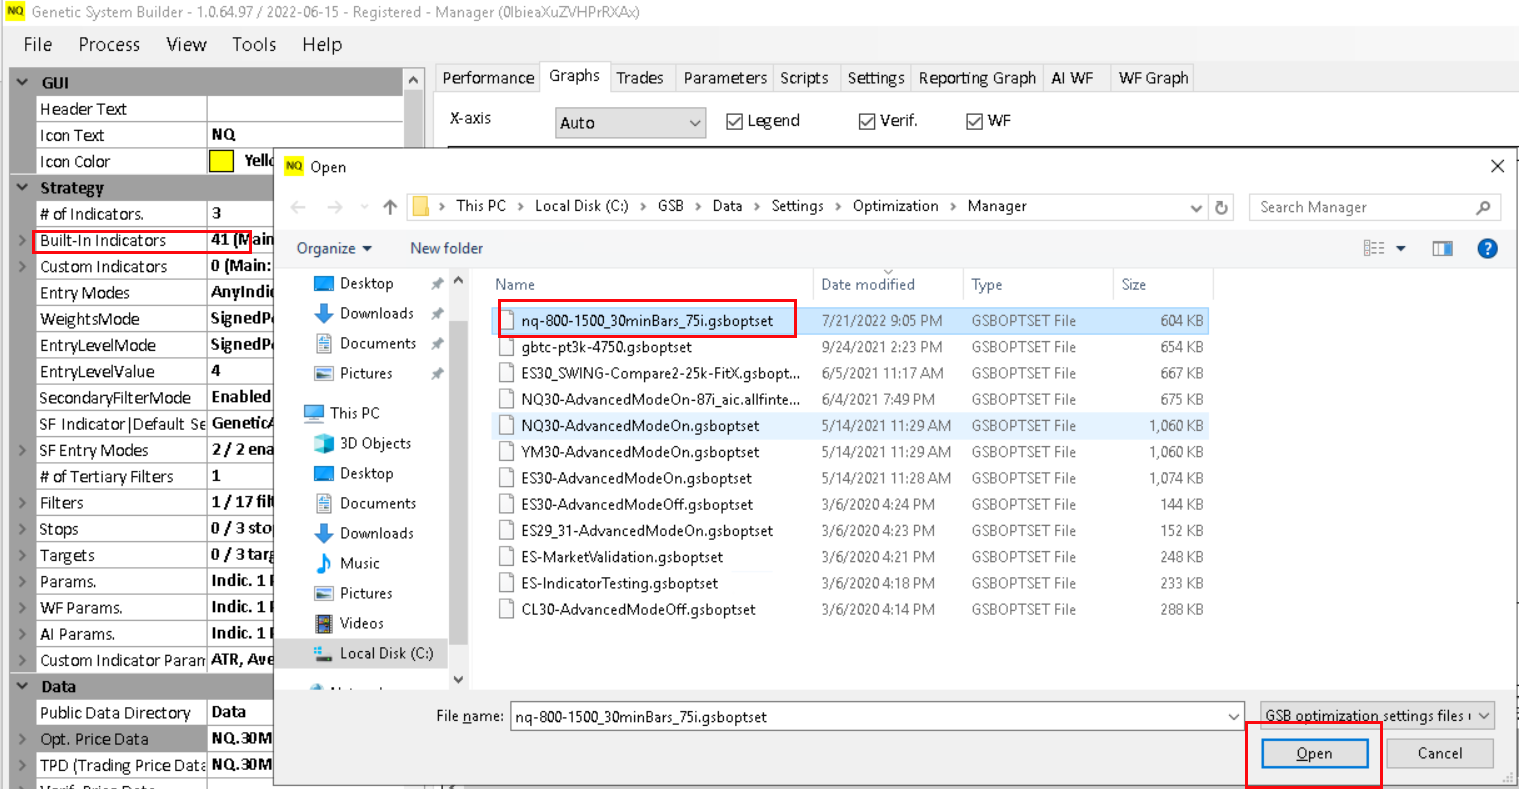
Opening GSB Manager with Nasdaq settings—loads 41 (trial) or 75 (purchased) pre-selected indicators
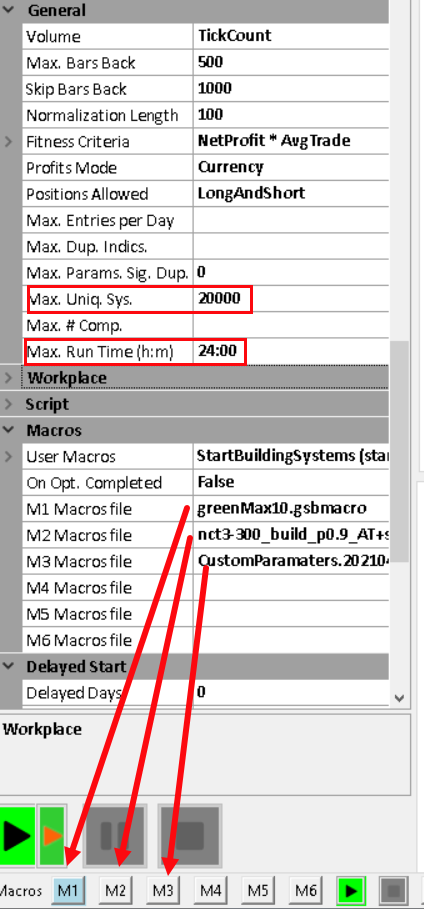
After building 20,000 systems, GSB automatically identifies the 10 best indicators for this market
Rebuild 20,000 systems using your proven indicators:
• Use only the 10 best indicators from Step 1
• Run NCT3-300 macro for automatic filtering
• Top 300 systems sorted into Favorites B, C, D
• Statistics A: in-sample (2007-2017)
• Statistics B-E: yearly out-of-sample (2017-2021)
• Statistics F: entire out-of-sample period combined
Favorite D contains your most robust candidates.
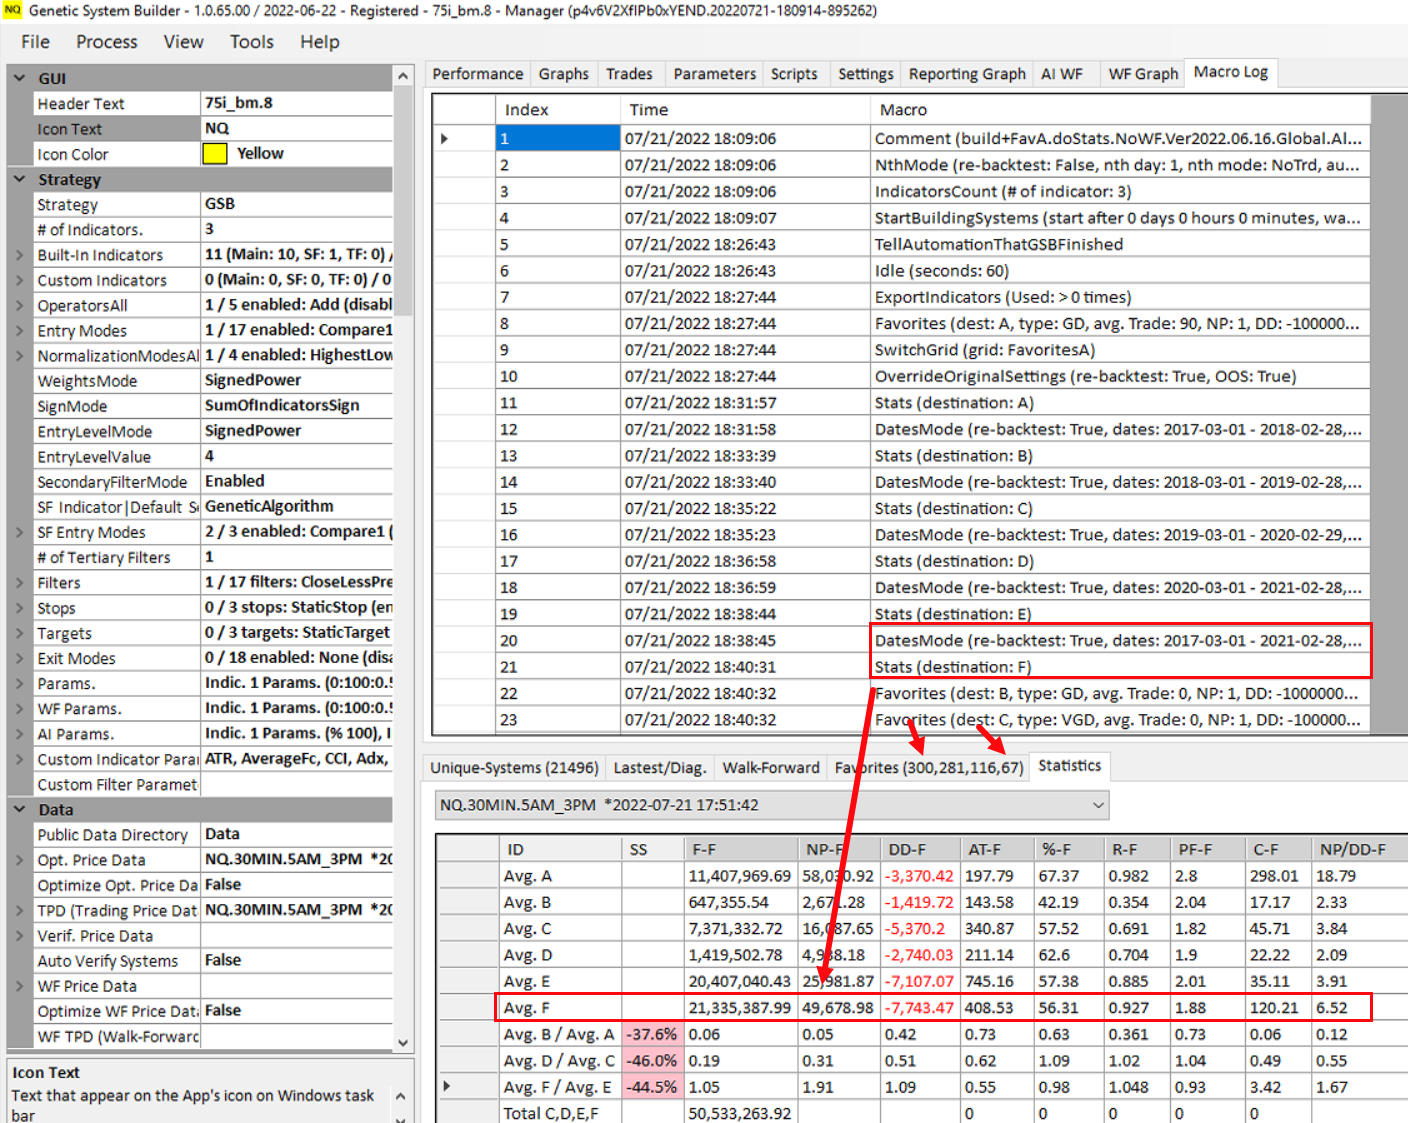
Statistics showing $49,678 average profit across entire 2017-2021 out-of-sample period for top 300 systems
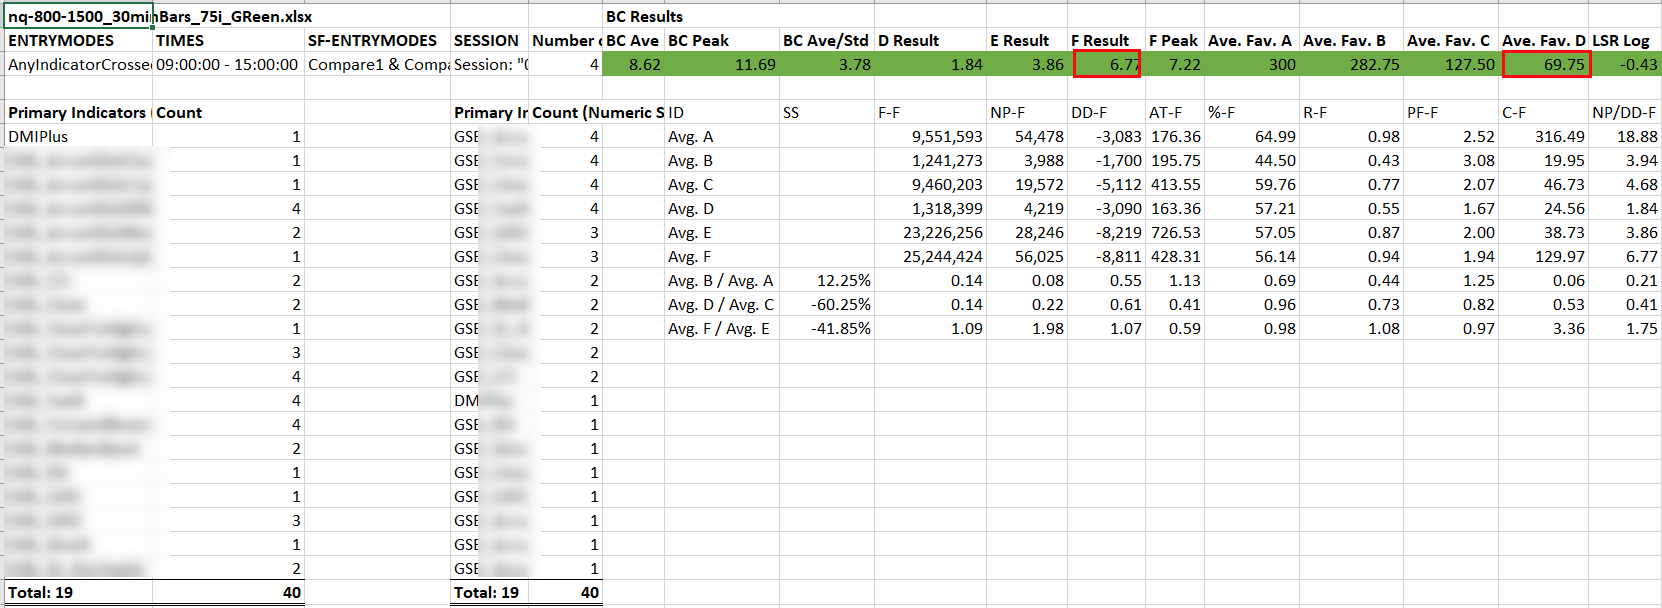
Visual Basic spreadsheet output showing key metric: F result of 6.77 (net profit/drawdown for out-of-sample period)
Group similar systems to find stable strategies:
• Put all Favorite D systems into family groups
• Each family = variations of same core strategy
• Look for families where MOST members perform well
• Ideal: at least 3 members, all profitable on unseen data
• Reject families with inconsistent member performance
This step separates robust systems from lucky outliers.

67 systems in Favorite D organized into 9 families—top family has 41 members (parameter variations)
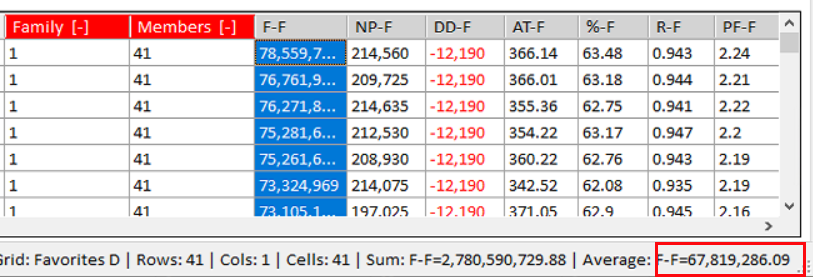
Family 1 average fitness: 67,819,286—highest member count and best average performance
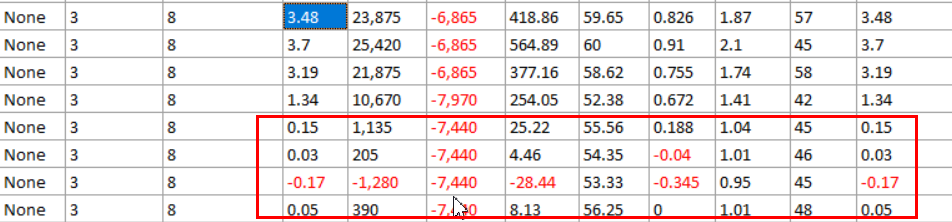
Family 3 from different setup showing 4 members with poor performance—reject families with inconsistent results
Verify systems work on most recent data:
• Change dates to "ALL" (includes current date)
• Extends out-of-sample by 1+ years
• Select all systems in chosen families
• Verify average fitness stays high
• Check that most family members remain profitable
• Review equity curves for linearity and drawdowns
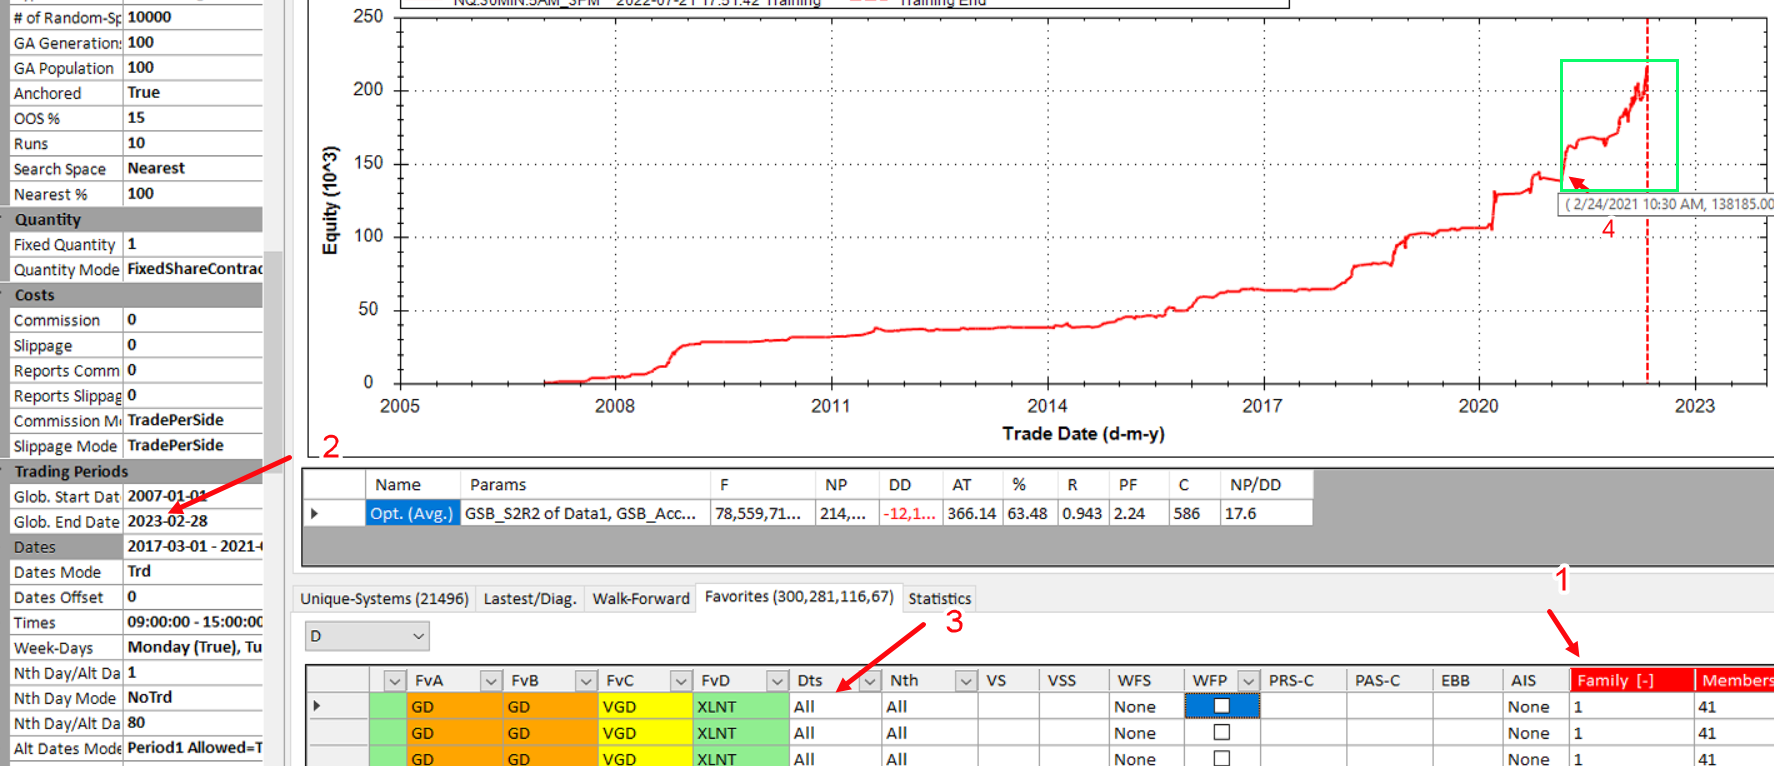
Changing dates to include most recent data to verify systems work on completely unseen market conditions
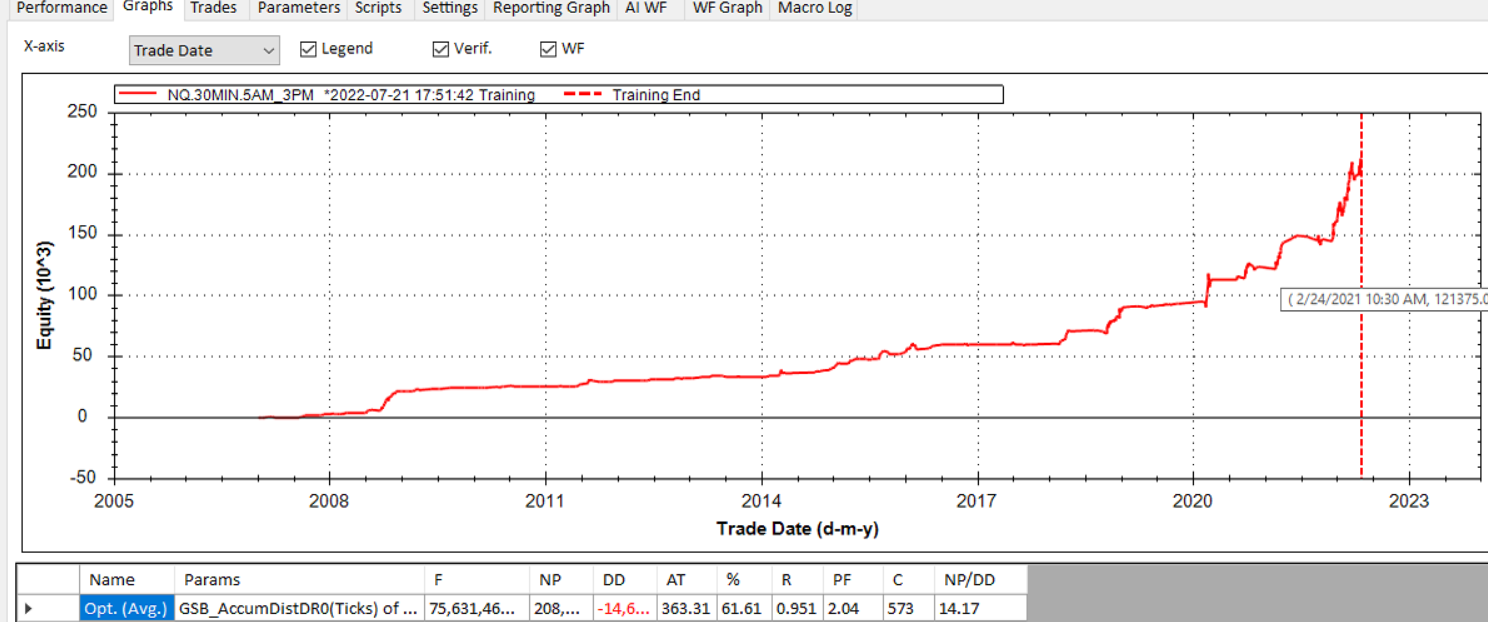
Even the worst of 41 systems in Family 1 shows $208k profit and $14.6k drawdown—confirms family robustness
Generate fresh performance data on your finalists:
• Select top members from best families
• Criteria: highest member count + highest average fitness
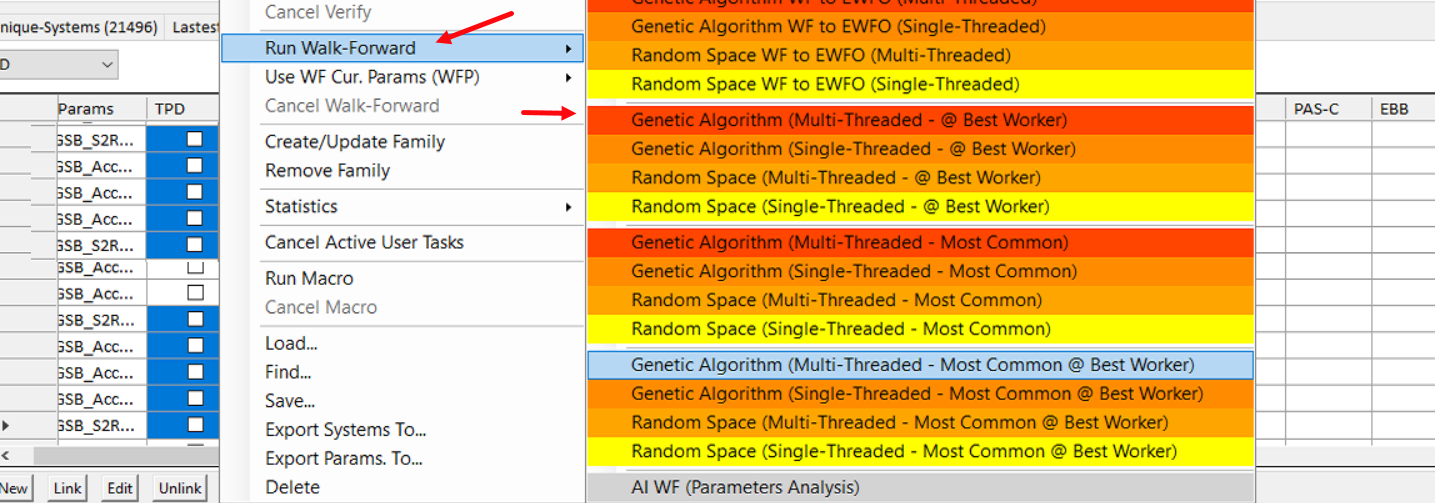
• Walk-forward these systems one final time
• Examine curves for tight, parallel lines
• Look for high anchored and rolling stability scores
Systems with parallel WF curves and strong stability are ready for live trading consideration.
Walk-forward curves showing parallel lines, high stability scores, and strong performance metrics
Final check to ensure all components work:
• Test each indicator individually in final systems
• Comment out all others, test one at a time
• Verify profitability after last training date
• For 2022 builds: check March 2021 to present
• Remove any indicators that fail on recent data
This catches components that helped in optimization but fail on fresh data.
Results & Insights
Using this methodology with entry mode AnyIndicatorCrossed and the beta indicator set, the top 300 systems averaged $49,678 profit across the entire 2017-2021 out-of-sample period. The best families typically have 40+ members with average fitness scores exceeding 67 million. Critical insight: family analysis reveals the difference between curve-fitted systems and genuinely robust ones. When a family has members with widely varying results (some profitable, some losing), it signals excessive parameter sensitivity—avoid these families. The strongest families show consistent profitability across all members, indicating the edge is real and not dependent on precise parameter values. Market conditions heavily influence results: 2021-2022 were exceptional for Nasdaq systems, producing much higher returns than typical periods. Always verify systems work across multiple market regimes, not just favorable conditions.
Key Takeaways
Two-pass optimization (indicators first, then systems) prevents overfitting while ensuring quality components
Multiple out-of-sample periods (yearly splits) catch systems that only work in specific market conditions
Family analysis is crucial—look for families where ALL members are profitable, not just the top one
Average family fitness matters more than individual system fitness for selecting robust strategies
Entry mode matters significantly: Compare2 works well for Crude Oil but poorly for S&P 500; Crossover Dual excels for S&P but fails on Crude
Extended out-of-sample verification (data through current date) is the final reality check before considering live trading
Using GSB Automation to run this process 4 times and selecting the best results improves overall system quality
Based on methodology examples from the original GSB/TradeMaid documentation, used with permission.