
Core GSB Methodology: From Baseline to Robust Trading Systems
The foundational five-part process for discovering robust trading systems: establishing a baseline, identifying effective indicators, building optimized systems, fine-tuning settings, and selecting strategies for live trading.
Scenario
Traders often struggle to identify which indicators and parameter combinations will produce genuinely robust trading systems. The challenge isn't just finding strategies that perform well on historical data—it's discovering systems that maintain their edge on completely unseen data. This methodology provides a systematic framework for building systems that pass rigorous validation requirements including walk-forward testing, noise resistance verification, and stability analysis across multiple time periods.
Approach
Build 50,000 initial systems to set your performance benchmark:
• Use default settings with a broad set of indicators
• Walk-forward the top 250 systems
• Add noise to data streams and verify system stability
• Test top 90 systems by Anchored Stability score
• Test top 91 systems by VSS (Volatility Stability Score)
• Record performance across multiple time periods
This baseline gives you a benchmark to measure all future improvements against.
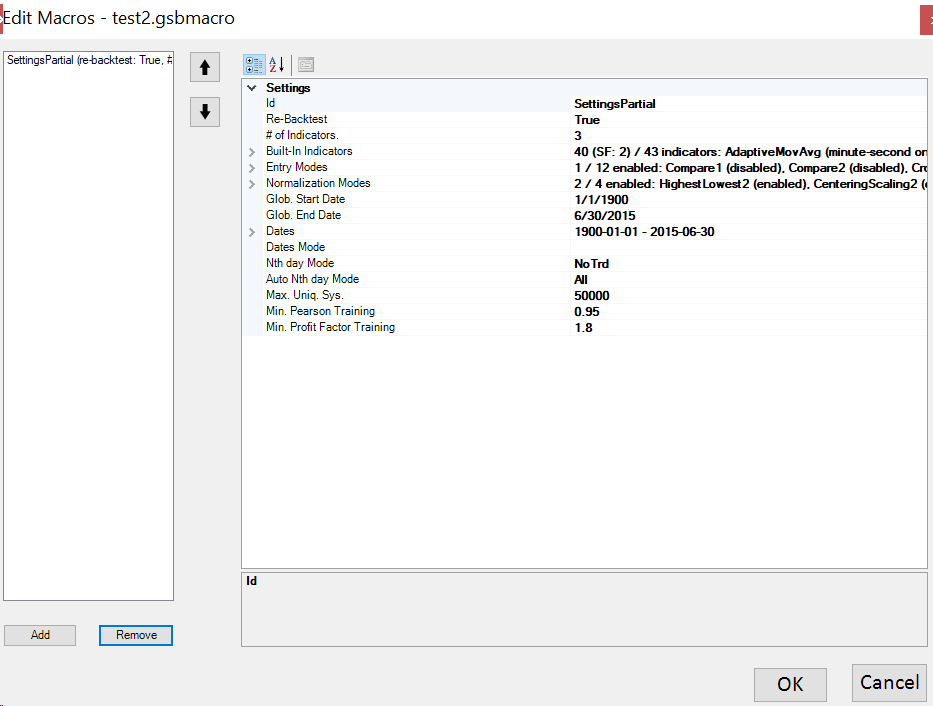
Initial settings for Part A baseline build using Entry Level mode and SignPower weight mode

Macro 3 workflow: puts performance stats into Stats A-F across multiple time periods
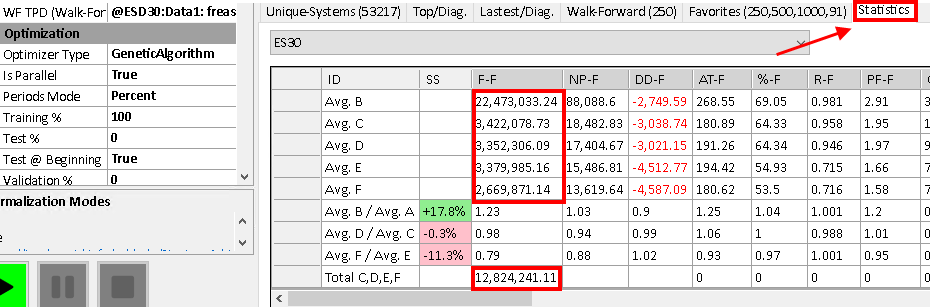
Example statistics display - note numbers in red are divided by 1000 for clarity

Recording baseline performance statistics across different time periods and system selection methods
Discover which indicators actually work for your market:
• Build 20,000 systems using single indicators only
• Sort all results by fitness score
• Analyze the top 10,000 performing systems
• Identify the 9-11 indicators that appear most frequently
• Save these winning indicators to your settings file
This data-driven approach removes guesswork and personal bias from indicator selection.
Now rebuild using only your proven indicators:
• Build 50,000 new systems using your filtered indicator set
• Walk-forward the top 250 systems again
• Run noise testing to verify robustness
• Compare stability scores to your baseline
• Record all performance statistics
You should see improvement over your baseline. If not, review your settings.
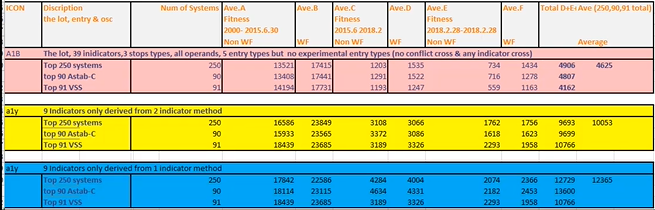
Performance comparison after building with optimized indicator set from Part B
Test variations to find optimal configuration:
• Try different normalization modes (center scaling, etc.)
• Test various indicator counts (2 vs 3 indicators)
• Experiment with secondary data streams
• Compare entry types (Compare2, Crossover, AnyIndicatorCross)
• Run full validation for each variation
• Record which settings give best walk-forward results
Common findings: Compare2 works well for Crude Oil, while Crossover Dual excels for S&P 500.
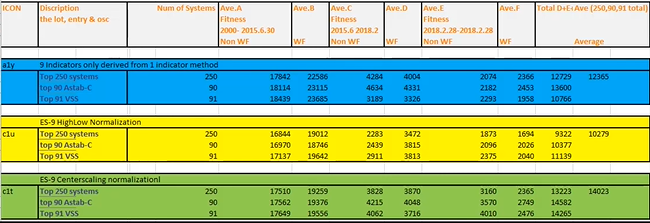
Part D results showing impact of normalization modes and other settings variations
Choose your final candidates carefully:
• Pick either top Anchored Stability systems OR top VSS systems
• Create family groups to find related systems
• Select top 1-3 families where most members perform well
• Walk-forward these finalists one more time
• Extend out-of-sample period to most recent data
• Verify equity curves stay positive through current market
Systems appearing in 80%+ of family members show exceptional robustness.
Results & Insights
This methodology consistently produces systems with strong walk-forward efficiency and out-of-sample performance. Key insight: indicator selection matters more than most traders realize. The indicators that work best on one market may perform poorly on another—automated testing across 20,000+ systems reveals these patterns that would take years to discover manually. Systems built through this process typically show 70-90% walk-forward efficiency and maintain positive performance on data the system has never seen during optimization. The noise verification step filters out curve-fitted strategies that would fail in live trading.
Key Takeaways
Build a baseline first—you need a benchmark to measure improvements against
Let the data identify the best indicators rather than relying on popular choices
Noise testing is critical for filtering out over-optimized systems
Walk-forward validation across multiple time periods catches systems that only worked in specific market regimes
Family analysis reveals parameter sensitivity—stable systems have multiple family members with similar performance
The methodology is iterative—each part improves on the previous baseline
Based on methodology examples from the original GSB/TradeMaid documentation, used with permission.